Team:UESTC Software/Validation
Validation
Photo From © PEXELS
Step 1
We pick a organism from the 29 organisms(from no.1~no.29) one by one as 29 experiments . Then respectively use the remaining 28 organisms to screen the minimal gene set again and compare the results with the completed(29 organisms) one to get the overlapRatio.
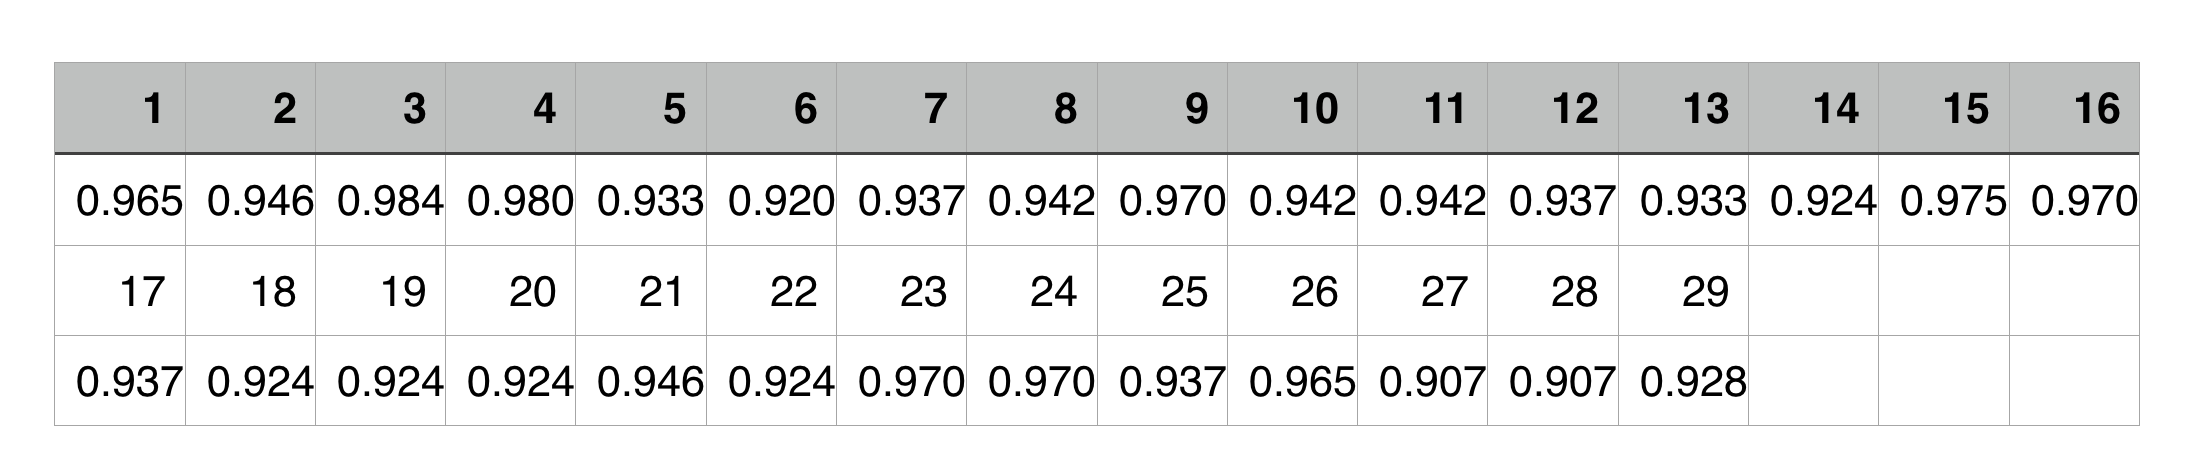
The line chart is as follow:

The variance of the overlapRatio is 0.000479
From the line chart and the variance, we could easily get a conclusion that all the experiments’ overlapRatios are more than 90% and vary slightly, which means our strategy is accurate and stable.
Step 2
Then let’s move to step 2. In step 1 we proved that our strategy is stable and accurate. Next, we compare the result with other two results(Gil, Mushegian&Koonin) which has got the minimal gene set by using other methods to prove our method is reliable and significant.
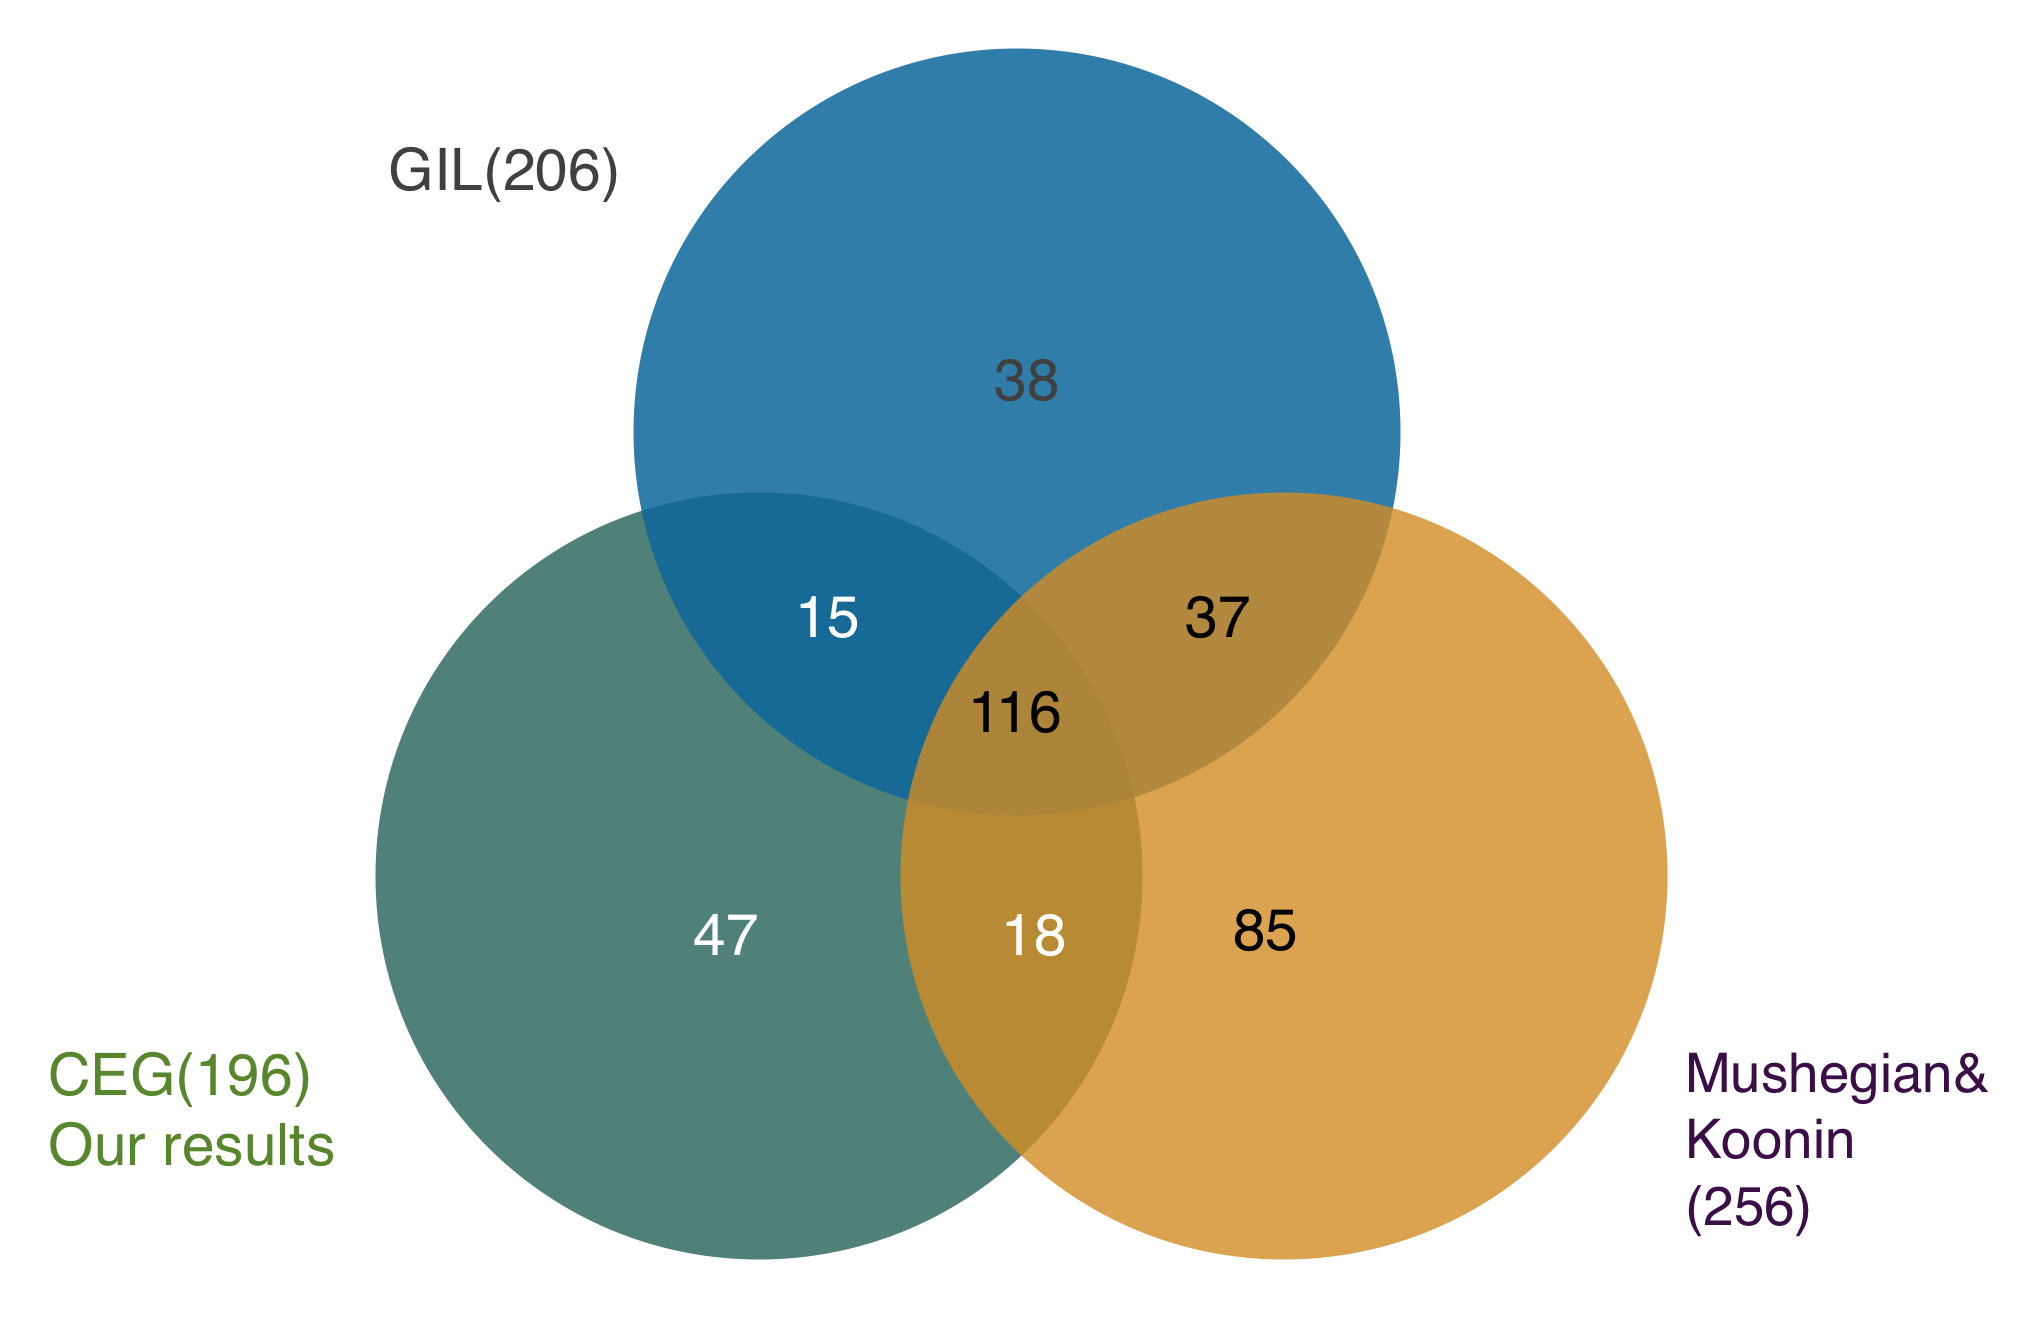
From the flow charts, unlike these two groups we have fewer genes in our minimal gene set , and have a high overlapping numbers for having 131 same genes with the Gil, and 134 genes with the Mushegian&Koonin’s result. There are also 47 undiscovered genes in our result. After this step, it’s obvious that our result is reliable and significant.
Step 3
In step 3, we try to get the MCCAP’s calculating time. We test the experiment no.1~no.25(4 organisms ~ 28 organisms like step 1&2) in our 42% ratio retaining method to get the running time.
The bar chart is as follows:

From the bar chart , as the increasing number of organisms, the running time increases gradually. But when we use all of the organisms from CEG data base. We still only spend less than 0.5s to get the results. The efficiency of MCCAP’s calculating can be accepted, and MCCAP did well in this aspect.