Difference between revisions of "Team:DTU-Denmark/Project/MAGE"
| Line 189: | Line 189: | ||
<li > | <li > | ||
<a href="/Team:DTU-Denmark/Achievements" | <a href="/Team:DTU-Denmark/Achievements" | ||
| − | > | + | >Key Achievements |
</a></li> | </a></li> | ||
<li > | <li > | ||
Revision as of 04:00, 19 September 2015

Overview Strain
In order for MAGE (Multiplex Automated Genome Engineering) to work at a high efficiency, a strain with inserted recombinase and inhibited or knocked out mismatch repair gene has to be used [1]. In our project, two different recombinases were used: a recombination protein Beta from the E. coli phage Lambda, which was codon optimized for B. subtilis 168, and GP35, a recombinase from the B.subtilis phage SPP1 [2]. The mismatch repair proteins known as MutS and MutL were knocked out by transforming pSB1C3_recombinase plasmid into the B. subtilis W168. Since the MutL protein is dependent on the binding of MutS, the knockout of the mutS disables the function of the MutL protein [3]. For doing proof of concept of MAGE in B. subtilis 168 four different strains was produced via genetic recombineering. All derived from Bacillus subtilis 168 WT:
- ∆amyE::beta-neoR
- ∆amyE::GP35-neoR
- ∆mutS::beta-neoR
- ∆mutS::GP35-neoR
Methods Strain
All the strain were made by homologous recombineering. Plasmids containing cassettes that were able to do a double-crossover homologous recombineering into the genome of B. subtilis 168 (referred to as knockout (KO) plasmid). These were used to, simultaneously, delete the desired gene (amyE or mutS) and inserting the expression cassette for one of the recombinases: beta or GP35.
Four different plasmids was assembled to make the four MAGE ready strains:
pDG268neo_Beta-neoR
pDG268neo_GP35-neoR
pSB1C3_Beta-neoR
pSB1C3_GP35-neoR
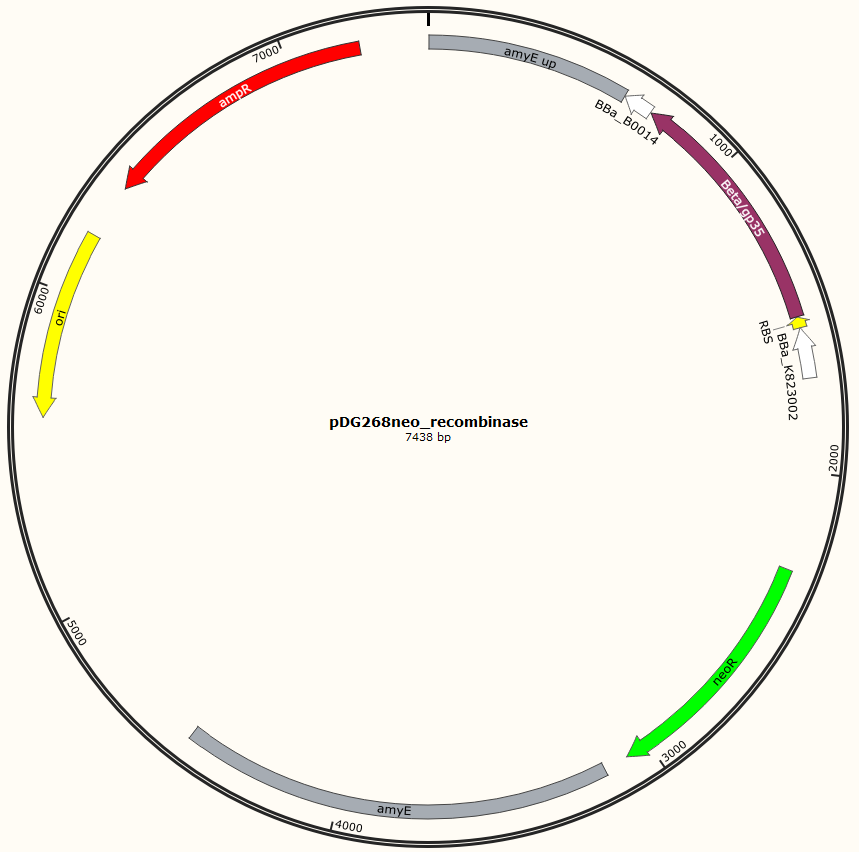
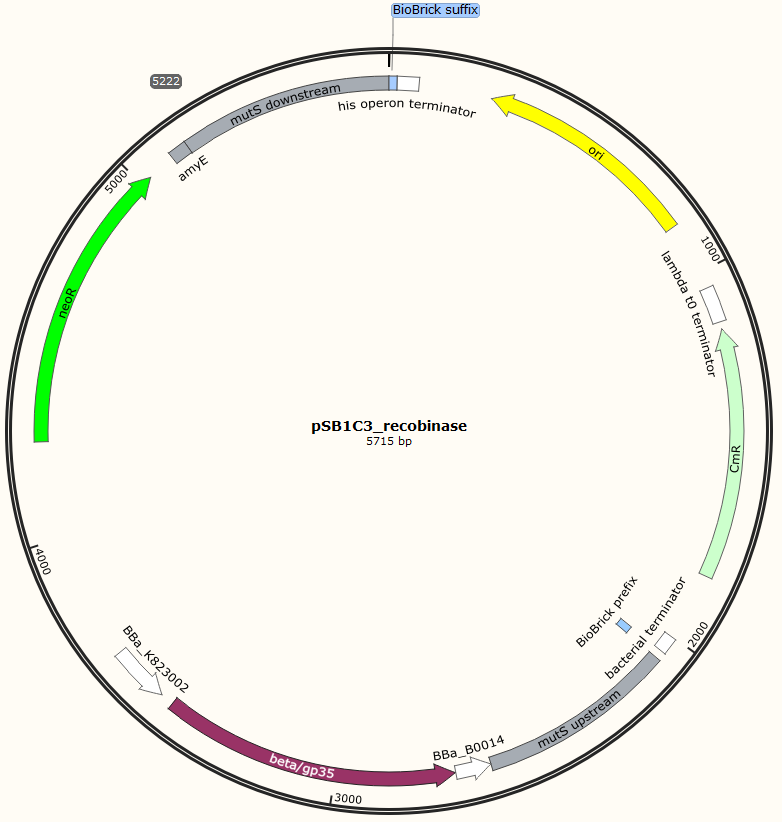
Missing: figure tekst: Shows the general concepts of the two plasmids pDG268neo_recombinase and pSB1C3_recombinase. Both exists in two versions, one with each of the recombinase proteins CDSs (Beta and GP35). Those also have different RBSs since they are optimized for the CDS. Upstream of neoR is a promoter and RBS and downstream of neoR is a terminator, but sequences and positions of these features are not known.
For pDG268neo_recobinase a DNA sequence containing following features
Missing: make a table on following
● Promoter: PliaG from BBa_K823002 was used.
● RBSs were optimized for the specific CDS using the salis lab RBS calculator (Missing https://www.denovodna.com/software/)
● CDS for recombination protein beta or GP35
● Terminator: we use rho-independent Part:BBa_B0014
Sequence was ordered from IDT as two gblocks (for each recombinase) with overlapping regions, thus they can be assembled with Gibsom assembly.
pDG268neo was linearized in a PCR with primers, so that the native lacZ was omitted. This linearized plasmid was purified and used in a Gibsom assembly reaction with two cognate gblocks. This is shown on the figure missing.
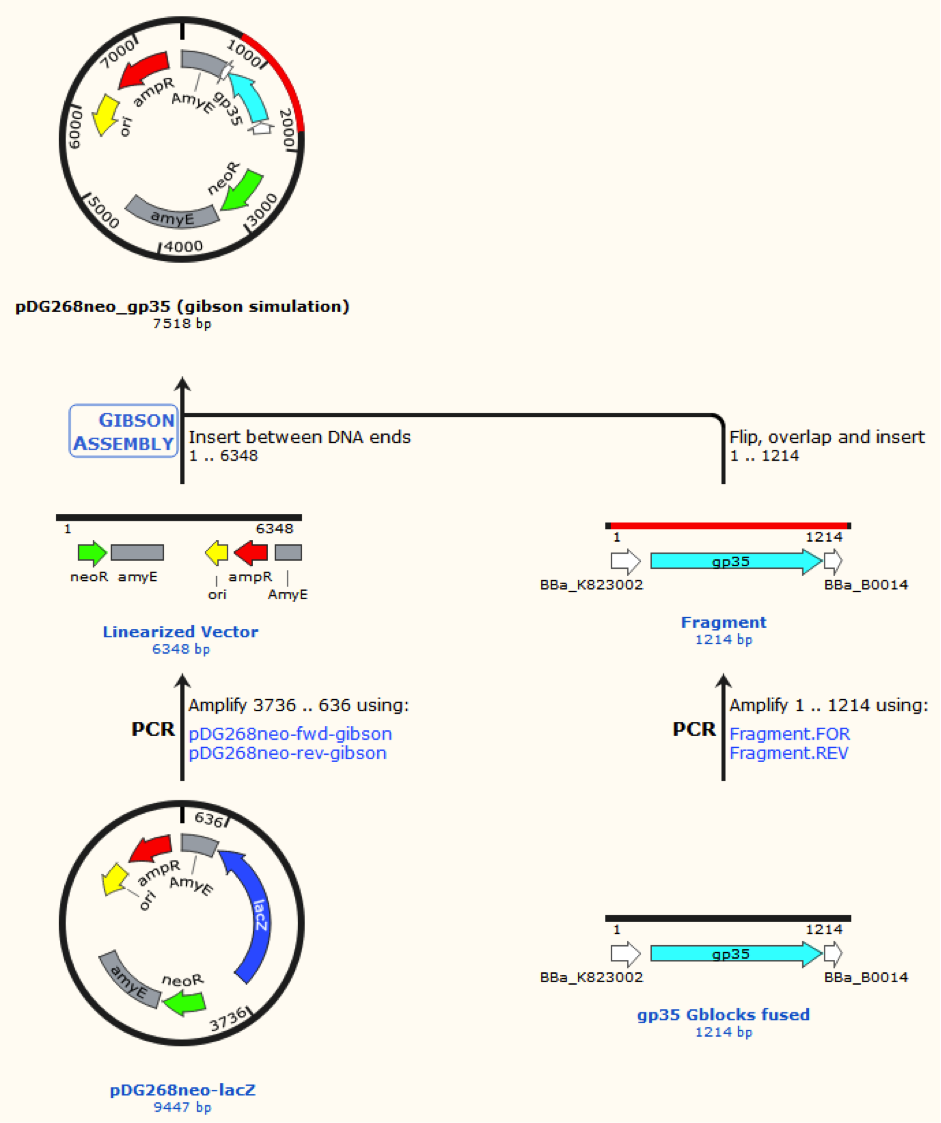
Missing figure text: Gibsom assembly of the pDG268neo_GP35, the gblocks was fused to the “gp35 Gblocks fused” in the same reaction. The Gibsom assembly of pDG268neo_beta was similar.
This resulted in two different plasmids pDG268neo_beta and pDG268neo_gp35.
The two mutS KO plasmids was made of the following DNA fragments:
1. About 500 bp up- and downstream from mutS was amplified, using primers with tails.
2. Recombinase and neoR expression cassettes was amplified from the pDG268neo_recombinase
3. Linearized pSB1C3 was used as template.
These fragments was assembled into two different plasmids pSB1C3_mutS::beta-neoR and pSB1C3_mutS::gp35-neoR using Gibsom assembly.
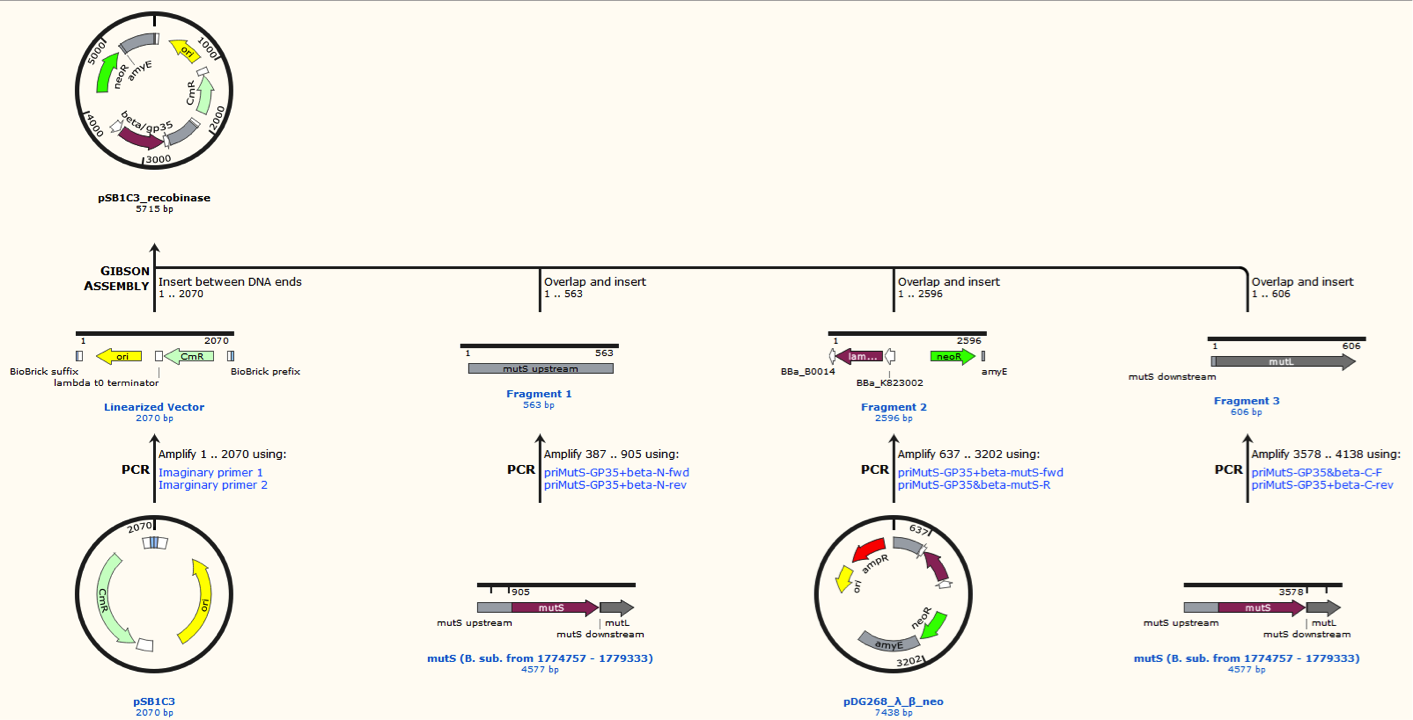
Missing figure text: Gibsom assembly of the pSB1C3_beta. The feature called “mutL” corresponding mutS downstream. The Gibsom assembly of pSB1C3_GP35 was similar.
All plasmids were verified by restriction enzyme digestion.
We prepared naturel competent B. subtilis 168 to be transformed. The plasmids were linearized with restriction enzymes. Then transformed into naturally competent B. subtilis 168, transformants were selected on 5ɣ neo. Transformants were verified with colony PCRs.
Optimization of MAGE in B. subtilis
Background
Oligo amount was predicted to be optimal at 5 µM oligo added to electrocompetent cells [1].
The optimal length of oligos in E.coli has shown to be 90nt [4]. We wanted to test if this is also the case for B. subtilis.
The mismatch frequency was desired to quantify the frequency of inserting bigger changes in the genome. In E. coli the larger mismatch part is the lower is the transformation frequency[4].
Experimental design
Using the dilution equation and the functional MAGE method, different experiments were run to optimize the efficiency of MAGE in Bacillus.
The three analyzed factors include amount of oligo used, the length of the oligos and the impact of the number of base pair mismatches in the oligo.
Achivements
- characterized the insertion frequency of mismatches in the genome of B. subtilis
- characterized the insertion frequency of oligoes with different length in the genome of B. subtilis
- The an estimate of the optimal amount of oligo was found
Methods
All three experiments followed "MAGE in Bacillus subtilis 168" protocol. The oligo we used is shown below introducing streptomycin resistance with one mismatch.
| oligo name | sequence | length |
| B_Sub_Mods0007.1mutationrpsL |
GAAGTGCTGAGTTCGGTTTgttCGGTGTCATTGTACCAACACGAGTACATACCCCGCGTTTTTGTGGAGAAGATACGTTAGTGTGCTCTT |
90 |
The amount of oligo was varied between 0.05 - 6.25uM.
In the mismatch frequency experiment six oligos with 1-6 mismatches individually.
For the varying of length ssDNA from 50-100nt was used with one mismatch.
In all experiment single colonies were taken from appropriate dilutions and colony picked onto 500ɣ strep. plates. Number colonies that was growing on colony picked strep plates was counted. The transformation efficiency was calculated as the ratio between re-streaked colonies growing on LB and on 500ɣ strep.
Results

Figure 1. the efficacy of oligo amount versus transformation rate
The Figure 1 above shows the transformation frequency for the oligo amount experiment.
The transformation frequency varies from 18-50% in the oligo amount experiment, this seems to be a too high number when comparing to earlier results and the standard transformation frequency for MAGE in E. coli. The data seems to suggest that the optimal oligo amount for transformation is 5 uM. This correlates with the optimal amount for E coli [4].
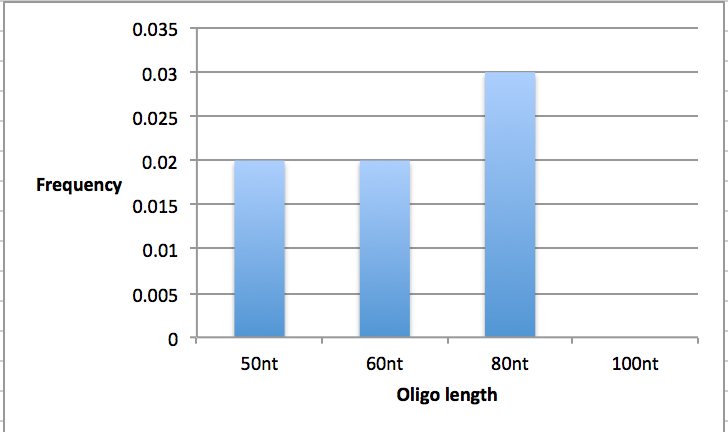
Figure 2 Shows the transformation frequency of oligo length.
The oligo length data shown in Figure 2 seems to suggest that the optimal oligo length is 80nt this correlates well with the the optimal length for E coli being 90nt.
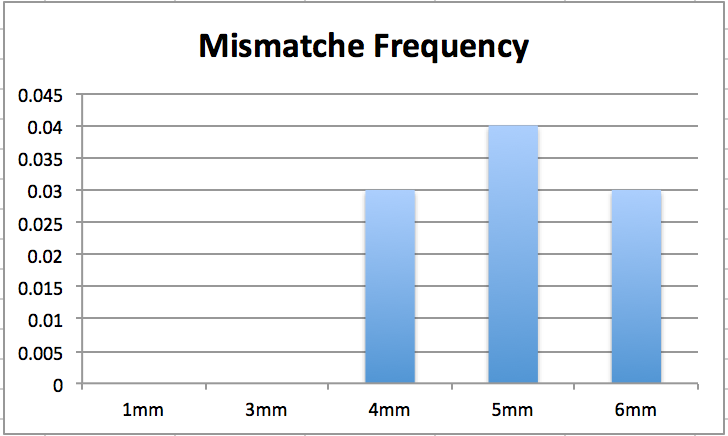
Figure 3 Shows transformation frequency of with extra mismatches from 1-6.
The Figure 3 above showes the transformation frequency for mismatch insertion. This results does not correleate with the asomption that the lower the amount of mismatches the higher the transforation rate. Here the opposite is shown. This can be do to the high uncertanty in using streptyomcine resistens.
The three Figures shown above varieties greatly. It is possible that the cells were not optimally electro competent. These experiment need to be redone to define if the experimental setup is incorrect or if some other variation is in play.
Selection of the colonies was difficult because of possible background from spontaneous mutants that became visible after 2 days and the risk of adding too much cell mass onto the plate when colony picking, this could be mistaken as a growing colony.
The results will need to be validated preferably using another screening method, since false positives seems to be an issue when using streptomycine as selection marker. It could be suggested to use a GFP with a inserted stop codon in the genome. The MAGE protocol could then be optimized for making knockins, this could be screened by using flow cytometry.
Conclusion
The experiements indicate that that 5 mismatches of with a length of 80nt and using 5uM of oligo would optimize the MAGE method. The data is of pure quality and nothing certain can be concluded from this experiment.
Multiple Bacillus MAGE cycles
Background
A great strength of the MAGE method is that it can be iterated until the amount of cells with the wanted change high (doi:10.1038/nature08187). We wanted to best if this also is the case in B. subtilis. Our experiments suggest that the this might be the case.
Experimental design
We hypothesized that if the MAGE protocol was repeated multiple times the amount of transformants would rise. This was tested by running four cycles of the OGRE protocol. The progress could be followed by plating a dilution of the sample on streptomycin plates after every round and calculating the start value of the culture from the OD600 measurements. It was necessary to colony pick colonies onto streptomycin plates this gave usable results.
Achivements
· showed that colony picking is an ineffective method of quantifying OGRE frequency.
· showed that the knockout of mutS has a significant effect on
Materials
The protocol specially med for this procedure was followed . This protocol takes approximately 6 hours for every cycle. Four cycles was run
Results
We had problems with finding the optimal dilutions. This cause the lack of data for some of the samples, new cells were replated from the glycerol stock of the differed MAGE cycles, but same problem was encountered again. There was a high variation in the amounts of transformants on the plates. We recommend to use the OD calculator for making an approximation of the correct dilution factor.

Figure 4. The frequency for the insertion of the streptomycin phenotype can be seen for the samples.
The data for figure 4 can be seen here
It seems that mutS::beta is better than the wild type, mutS::GP35 and amyE::GP35. We cannot conclude that more MAGE cycles gives a higher yield than a single cycle, because this result is not constant when looking at Figure 4 variation in the data is so great. The experiment will need to be run with a better method of testing if the insertion has been incorporated into the genome.
Dilution Equation
Overview
The Imperial iGEM 2008 team has made an equation for calculating CFU from OD600. We tried to validate their equation by using our own data. Unfortunately the variation in our results was too high to validate their equation. Based on their results we made a calculator that could compute the optimal dilution for plating to get a countable number of colonies.
Method
All the LB plate counts that we have done in our project was gathered and analyzed for this experiment. the data that was used can be seen here.
Results
The Imperial College team modulated following equation.
Imperial equation: Y= 2*108 *X
Y = CFU/mL

Figure 1. Our attempt to validate the Imperial College 2008 teams OD too CFU measurements. It is clear that the R2 value is not close optimal.
As can be seen from the figure 1 shown above our data could not validate the equation completely. Though our data trends towards Imperials 2008s equation.
Dilution predictor
An equation for predicting a dilutions that will result in a countable number of CFUs was made from the Imperial College equation. The equation assume that 100µl is plated on a LB plate. The optimal amount of colonies is set to 150CFU on each plate.
YCFU=2*XOD*108
Yoptimal=150CFU/plate. This number can be varied to fit the user's preference.
d is the optimal dilution factor for getting 150CFU/plate. E.i. optimal dilution will be 10d.
\(Y_{optimal} = {{Y_{CFU} } \over {10^d* 10}}\)
\(Y_{optimal} = {{2*X_{OD}*10^8} \over {10^fd* 10}}\)
\(10^d= {{2*X_{OD}*10^8} \over {10*Y_{optimal}}}\)
\(d= log_{10}( {{2*X_{OD}*10^8} \over {10*Y_{optimal}}} ) , Y_{optimal}=150\)
\(d= log_{10}( {{2*X_{OD}*10^8} \over {10*150}} ) \)
\(d= log_{10}( {{1.33*X_{OD}*10^5} } ) \)
The formula has not been thoroughly test and the correlation between OD and CFU is low in for our data. Generally the formula overestimates dilution. Therefore we suggest that both 10d and 10d-1 are plated. A future solution to the problem could be to introduce a calibration constant to the right hand side of the equation. The constant can be fitted by rerunning the experiment with more samples.
References
- Carr, P. A., Wang, H. H., Sterling, B., Isaacs, F. J., Lajoie, M. J., Xu, G., … Jacobson, J. M. (2012). Enhanced multiplex genome engineering through co-operative oligonucleotide co-selection. Nucleic Acids Research, 40(17). doi:10.1093/nar/gks455
- Sun, Z., Deng, A., Hu, T., Wu, J., Sun, Q., Bai, H., … Wen, T. (2015). A high-efficiency recombineering system with PCR-based ssDNA in Bacillus subtilis mediated by the native phage recombinase GP35. Applied Microbiology and Biotechnology, 99(12), 5151–5162. doi:10.1007/s00253-015-6485-5
- Ginetti, F., Perego, M., Albertini, A. M., & Galizzi, A. (1996). Bacillus subtilis mutS mutL operon: Identification, nucleotide sequence and mutagenesis. Microbiology, 142(8), 2021–2029. doi:10.1099/13500872-142-8-2021
- Wang, H. H., Isaacs, F. J., Carr, P. A., Sun, Z. Z., Xu, G., Forest, C. R., & Church, G. M. (2009). Programming cells by multiplex genome engineering and accelerated evolution. Nature, 460(7257), 894–898. doi:10.1038/nature08187

Department of Systems Biology
Søltofts Plads 221
2800 Kgs. Lyngby
Denmark
P: +45 45 25 25 25
M: dtu-igem-2015@googlegroups.com