Difference between revisions of "Team:UESTC Software/Software.html"
(Created page with "<html class="no-js"> <head> <meta charset="UTF-8"> <link rel="stylesheet" href="https://2015.igem.org/Template:UESTC_Software/CSS?action=raw&ctype=text/css"> <...") |
|||
| Line 2: | Line 2: | ||
<head> | <head> | ||
<meta charset="UTF-8"> | <meta charset="UTF-8"> | ||
| + | <title>Modeling</title> | ||
<link rel="stylesheet" href="https://2015.igem.org/Template:UESTC_Software/CSS?action=raw&ctype=text/css"> | <link rel="stylesheet" href="https://2015.igem.org/Template:UESTC_Software/CSS?action=raw&ctype=text/css"> | ||
| − | |||
<link rel="stylesheet" href="https://2015.igem.org/Template:UESTC_Software/wen_css?action=raw&ctype=text/css"> | <link rel="stylesheet" href="https://2015.igem.org/Template:UESTC_Software/wen_css?action=raw&ctype=text/css"> | ||
| + | <link rel="stylesheet" href="https://2015.igem.org/Template:UESTC_Software/divide_wen_css?action=raw&ctype=text/css"> | ||
<script src="https://2015.igem.org/Template:UESTC_Software/headjs?action=raw&ctype=text/javascript"></script> | <script src="https://2015.igem.org/Template:UESTC_Software/headjs?action=raw&ctype=text/javascript"></script> | ||
| − | |||
</head> | </head> | ||
<body> | <body> | ||
<header class="dou_header"> | <header class="dou_header"> | ||
| − | + | <div class="header_logo"> | |
| − | + | <a href="javascript:void(0)"><img src="/wiki/images/f/fc/Uestc_software_head_logo.png"></a> | |
| − | + | </div> | |
| − | + | <nav class="dou_divide_nav"> | |
| − | + | <div class="dou_divide_nav_wrap"> | |
| − | + | <ul> | |
<li> | <li> | ||
<a href="https://2015.igem.org/Team:UESTC_Software">HOME</a> | <a href="https://2015.igem.org/Team:UESTC_Software">HOME</a> | ||
</li> | </li> | ||
| − | <li> | + | <li class="choose"> |
<a class="" href="javascript:void(0)">PROJECT<br/><i class="iconfont"></i></a> | <a class="" href="javascript:void(0)">PROJECT<br/><i class="iconfont"></i></a> | ||
<ul id="menu_pro" class="dou_divide_nav_second clearfix"> | <ul id="menu_pro" class="dou_divide_nav_second clearfix"> | ||
| Line 27: | Line 27: | ||
<li><a href="https://2015.igem.org/Team:UESTC_Software/Modeling.html">Modeling</a></li> | <li><a href="https://2015.igem.org/Team:UESTC_Software/Modeling.html">Modeling</a></li> | ||
<li><a href="https://2015.igem.org/Team:UESTC_Software/Software.html">Software</a></li> | <li><a href="https://2015.igem.org/Team:UESTC_Software/Software.html">Software</a></li> | ||
| − | <li><a href="https://2015.igem.org/Team:UESTC_Software/User guide.html">User guide</a></li> | + | <li><a href="https://2015.igem.org/Team:UESTC_Software/User-guide.html">User guide</a></li> |
</ul> | </ul> | ||
</li> | </li> | ||
| Line 37: | Line 37: | ||
</ul> | </ul> | ||
</li> | </li> | ||
| − | <li | + | <li> |
<a href="https://2015.igem.org/Team:UESTC_Software/Notebook.html">NOTEBOOK</a> | <a href="https://2015.igem.org/Team:UESTC_Software/Notebook.html">NOTEBOOK</a> | ||
</li> | </li> | ||
<li> | <li> | ||
| − | <a href="https://2015.igem.org/Team:UESTC_Software/Practices">HUMAN<br/>PRACTICE< | + | <a href="https://2015.igem.org/Team:UESTC_Software/Practices">HUMAN<br/>PRACTICE</a> |
| + | <!--<ul id="menu_hum" class="dou_divide_nav_second"> | ||
| + | <li><a href="https://2015.igem.org/Team:UESTC_Software/Game-human_practice.html">Game</a></li> | ||
| + | <li><a href="https://2015.igem.org/Team:UESTC_Software/Meet_up.html">Meet-up</a></li> | ||
| + | <li><a href="https://2015.igem.org/Team:UESTC_Software/Collaborations.html">Collaborations</a></li> | ||
| + | </ul>--> | ||
</li> | </li> | ||
<li> | <li> | ||
| Line 52: | Line 57: | ||
</li> | </li> | ||
</ul> | </ul> | ||
| − | |||
| − | |||
| − | |||
| − | |||
| − | |||
| − | |||
| − | |||
| − | |||
| − | |||
</div> | </div> | ||
| − | </ | + | </nav> |
| − | + | </header> | |
| − | < | + | <div class="modeling_div"> |
| − | + | <h1>Modeling&Validation</h1> | |
| − | + | <p>(Tools: php&Matlab)</p> | |
| − | + | <h2>Modeling</h2> | |
| − | + | <section> | |
| − | + | <h3>Overview</h3> | |
| − | </ | + | <p>Modeling is one of the most important parts in our project. In the modeling, the data we used mainly from the CEG (Cluster of Essential Genes)<sup>1</sup> data base.In the <b>CEG</b>, genes’ category were based on their corresponding <b>KEGG</b>(Kyoto Encyclopedia of Genes and Genomes) Orthology (KO) and <b>COG</b><sup>2</sup>(Clusters of Orthologous Group) category and function descriptions.</p> |
| − | </ | + | <p><b>Ubiquity-retaining strategy</b><sup>3</sup> was first put up by Koonin .E V, we used half-retaining strategy to cover the shortage. Actually we use the 42% as the ratio not the half. Our modeling is to find it and prove it logically.</p> |
| − | + | <p>In the modeling, we use the knowledge of statistic. Find the relation of size of minimal-gene-set with number of organisms and HNR(Half Number Ratio). HNR is a ratio value that we use to replace the “half” in our strategy. Then we construct the 3d modeling for that.</p> | |
| − | + | <p>Besides, to get the <b>ideal value</b> of HNR, we use the <b>multivariable linear regression</b> to get the fitting polynomial for the relation of OE rate with the HNR. From the polynomial, we find the appropriate <b>HNR</b> for our strategy, which has the highest OE rate and many other advantages compared with other HNR.Finally, we test our software’s <b>calculating time</b>: start as we input organisms until we get the output result.</p> | |
| + | <p>We divide our modeling into 3 steps.</p> | ||
| + | </section> | ||
| + | <section> | ||
| + | <h3>Step 1</h3> | ||
| + | <p>Firstly, we randomly choose 4 organisms from the data base(totally 29 organisms) as the experiment no.1 and rechoose 5 organism as experiment no.2 until we have 28 organisms in experiment no.25(We choose 10 times for one experiment, then get the <b>average of every data of it</b>) . we observed the trend of the size of minimal-gene-set from experiment no.1~25, and noticed a decrease trend when using the <b>ubiquity-retaining strategy</b>(Koonin) while a stabilization trend when using the <b>half-retaining strategy</b>. Line chart as follow(Fig 1.1):</p> | ||
| + | <img src="/wiki/images/6/6c/Team-UESTC_Software_figure1.1.jpg"> | ||
| + | <p>Obviously, the result of the half-retaining strategy seems more steady and more significant with the number of organisms’ increasing than the ubiquity-retaining strategy.</p> | ||
| + | <p>Secondly, to find the relationship between the <b>HNR</b>(Half Number Ratio) and the <b>size of minimal-gene-set</b>. We divide 100% into <b>100 groups</b> (1%~100%). Now we have 100 groups and 25 experiments. Then we respectively get the experiment no.1~25’s size of minimal-gene-set in every group. And finally get line charts like Fig 1.2 and Fig 1.3(Cause there are too much data that we only list the 1/10,2/10~10/10’s results in Fig 1.2):</p> | ||
| + | <img src="/wiki/images/5/5f/Team-UESTC_Software_figure1.2.jpg"> | ||
| + | <img src="/wiki/images/2/21/Team-UESTC_Software_figure1.3.jpg"> | ||
| + | <p>Our ideal size of minimal-gene-set is about 150~300. The conclusion is that the HNRs between interval <b>[30/100~51/100]</b> ’s size of minimal-gene-set are more close to the ideal amount. </p> | ||
| + | <p>Finally,To get a more particular knowledge of changing trend. We made a diagram to illustrate the <b>relation</b> of minimal gene set with number of organisms and HNR.</p> | ||
| + | <p>We use the <b>least square method</b> to get the <b>fitting polynomial</b> for every lines in the figure 1.2(100 polynomials here). We choose the <b>3 order</b> polynomial. To get the 4 coefficients for the polynomial, we use the same method to get the <b>relation of coefficient with the HNR</b>. The 4 coefficients’ fitting polynomials are as follows:</p> | ||
| + | <img src="/wiki/images/thumb/6/63/Team-UESTC_Software_gsabcd.jpg/800px-Team-UESTC_Software_gsabcd.jpg"> | ||
| + | <p>The polynomial for the relation of the minimal gene set with number of organisms and HNR is as follows:</p> | ||
| + | <img src="/wiki/images/c/cd/Team-UESTC_Software_gsz.jpg"> | ||
| + | <p>Now we have the polynomial to connect the relation of minimal gene set with number of organisms and HNR. The diagram is as follows:</p> | ||
| + | <img src="/wiki/images/6/6f/Team-UESTC_Software_NOO.jpg"> | ||
| + | <p>From diagram above, we found an area that have a stable gene number when organisms number changed. It means use these half number ratio can get a stable result of minimal gene set. But to find the most stable HNR for the “half” retaining strategy, let’s move to step 2.</p> | ||
| + | </section> | ||
| + | <section> | ||
| + | <h3>Step 2</h3> | ||
| + | <p>From the Step 1, we divided 100% into <b>100 groups</b> (1%~100%). And we also have 25 experiments. Besides, before doing the experiments, we should define a new variable to measure whether the strategy is stable and effective. We call it <b>OE rate</b>( Overlapping Effective Rate). It’s calculated by this formula:</p> | ||
| + | <img src="/wiki/images/d/dd/Team-UESTC_Software_gsOR.jpg"> | ||
| + | <p><i>cUGS: the number of current experiment’s universal-gene-set-result</i></p> | ||
| + | <p><i>UGS29:the number of 29-organism-experiment’s universal-gene-set-result</i></p> | ||
| + | <p>This formula is to reduce the influence of the Gene’s amount. More OE rate means the strategy has a more sufficient result.</p> | ||
| + | <p>Now we have 100 groups and 25 experiments. Then we respectively calculate experiment no.1~25’s <b>average of OE rate</b> in every group. And finally get this line chart like Fig 2.1:</p> | ||
| + | <img src="/wiki/images/f/f0/Team-UESTC_Software_HNR.jpg"> | ||
| + | <p>Obviously, we could find there are several groups has an ideal result, and also some unexpected results.</p> | ||
| + | <p>Next, we calculate experiment no.1~25’s <b>variance</b> in every group. Line chart as follow:</p> | ||
| + | <img src="/wiki/images/6/6a/Team-UESTC_Software_figure2.2.jpg"> | ||
| + | <p>From the Fig 2.2, comparing the variances we could easily find the groups between 26/100~61/100’s variances are less than others which means strategy in this interval is more steady. It’s fortunate that we nearly get the same conclusion with the best interval mentioned in step 1.</p> | ||
| + | <p>Fortunately, we got a pretty results. We use the <b>least square method</b> to get the <b>fitting polynomial</b>. The new curve graph like this:</p> | ||
| + | <img src="/wiki/images/thumb/5/5c/UESTC_Software_figure2.3.jpg/800px-UESTC_Software_figure2.3.jpg"> | ||
| + | <p>The polynomial is as follow:</p> | ||
| + | <img src="/wiki/images/5/5e/Team-UESTC_Software_gsy.jpg"> | ||
| + | <p>After comparing the order of polynomial,we choose the 4 order polynomial. The <b>correlation coefficient</b> is 0.9703. According to the list. The polynomial is 97% to be accepted.</p> | ||
| + | <p>Next we calculate the <b>maximization</b> point as our ideal HNR (42%). That is how we define the ratio value of the retaining strategy.</p> | ||
| + | </section> | ||
| + | <section> | ||
| + | <h3>Step 3</h3> | ||
| + | <p>In step 3, we try to get the MCCAP’s calculating time. We test the experiment no.1~no.25(4 organisms ~ 28 organisms like step 1&2) in our 42% ratio retaining method to get the running time.</p> | ||
| + | <p>The bar chart is as follows:</p> | ||
| + | <img src="/wiki/images/b/b3/Team-UESTC_Software_times.png"> | ||
| + | <p>From the bar chart , as the increasing number of organisms, the running time increase gradually. But when we use all of the organisms from CEG data base. We still only spend less than 0.5s to get the results. The efficiency of MCCAP’s calculating can be accepted, and MCCAP did well in this aspect.</p> | ||
| + | </section> | ||
| + | <section> | ||
| + | <h2>Validation</h2> | ||
| + | <h3>Step 1</h3> | ||
| + | <p>We pick a organism from the 29 organisms(from no.1~no.29) <b>one by one</b> as 29 experiments . Then respectively use the <b>remaining</b> 28 organisms to screen the minimal gene set again and compare the results with the completed(29 organisms) one to get the <b>overlapRatio</b>.</p> | ||
| + | <img src="/wiki/images/a/a6/Team-UESTC_Software_table.jpg"> | ||
| + | <p>The line chart is as follow:</p> | ||
| + | <img src="/wiki/images/3/38/Team-UESTC_Software_figure2.1.1.jpg"> | ||
| + | <p>The <b>variance of the overlapRatio</b> is 0.000479</p> | ||
| + | <p>From the line chart and the variance, we could easily get a conclusion that all the experiments’ overlapRatios are <b>more than 90%</b> and <b>vary slightly</b>, which means our strategy is <b>accurate</b> and <b>stable</b>.</p> | ||
| + | </section> | ||
| + | <section> | ||
| + | <h3>Step 2</h3> | ||
| + | <p>Then let’s move to step 2. In step 1 we proved that our strategy is stable and accurate. Next, we compare the result with other two results(<b>Gil, Mushegian&Koonin</b>) which has got the minimal gene set by using other methods to prove our method is <b>reliable</b> and <b>significant</b>.</p> | ||
| + | <img src="/wiki/images/thumb/f/fb/Team-UESTC_Software_figure3.jpg/800px-Team-UESTC_Software_figure3.jpg"> | ||
| + | <p>From the flow charts, unlike these two groups we have fewer genes in our minimal gene set, and have a higher overlap numbers for having 190 same genes with the Gil, and 156 genes with the Mushegian&Koonin’s result.Only 5 genes are different from other two groups. After this step, it’s obvious that our result is reliable and stable.</p> | ||
| + | </section> | ||
| + | <section> | ||
| + | <h2>Reference</h2> | ||
| + | <p>1.Yuan-nong Ye, Zhi-gang hua, Jian Huang, Nini Rao and Feng-biao Guo*: CEG: <b>a database of essential gene clusters</b>. BMC Genomics 2013</p> | ||
| + | <p>2.Roman L.Tatusov, Michael Y. Galperin, Darren A. Natale and Eugene V. Koonin*: <b>The COG database: a tool for genome-scale analysis of protein functions and evolution</b></p> | ||
| + | <p>3.Mushegian AR, Koonin EV:<b>A minimal gene set for cellular life derived by comparison of complete bacterial genomes</b>. Proc Natl Acad Sci U S A 93, 10268-10273 (1996).</p> | ||
| + | </section> | ||
| + | </div> | ||
</body> | </body> | ||
</html> | </html> | ||
Revision as of 06:58, 15 September 2015
Modeling&Validation
(Tools: php&Matlab)
Modeling
Overview
Modeling is one of the most important parts in our project. In the modeling, the data we used mainly from the CEG (Cluster of Essential Genes)1 data base.In the CEG, genes’ category were based on their corresponding KEGG(Kyoto Encyclopedia of Genes and Genomes) Orthology (KO) and COG2(Clusters of Orthologous Group) category and function descriptions.
Ubiquity-retaining strategy3 was first put up by Koonin .E V, we used half-retaining strategy to cover the shortage. Actually we use the 42% as the ratio not the half. Our modeling is to find it and prove it logically.
In the modeling, we use the knowledge of statistic. Find the relation of size of minimal-gene-set with number of organisms and HNR(Half Number Ratio). HNR is a ratio value that we use to replace the “half” in our strategy. Then we construct the 3d modeling for that.
Besides, to get the ideal value of HNR, we use the multivariable linear regression to get the fitting polynomial for the relation of OE rate with the HNR. From the polynomial, we find the appropriate HNR for our strategy, which has the highest OE rate and many other advantages compared with other HNR.Finally, we test our software’s calculating time: start as we input organisms until we get the output result.
We divide our modeling into 3 steps.
Step 1
Firstly, we randomly choose 4 organisms from the data base(totally 29 organisms) as the experiment no.1 and rechoose 5 organism as experiment no.2 until we have 28 organisms in experiment no.25(We choose 10 times for one experiment, then get the average of every data of it) . we observed the trend of the size of minimal-gene-set from experiment no.1~25, and noticed a decrease trend when using the ubiquity-retaining strategy(Koonin) while a stabilization trend when using the half-retaining strategy. Line chart as follow(Fig 1.1):
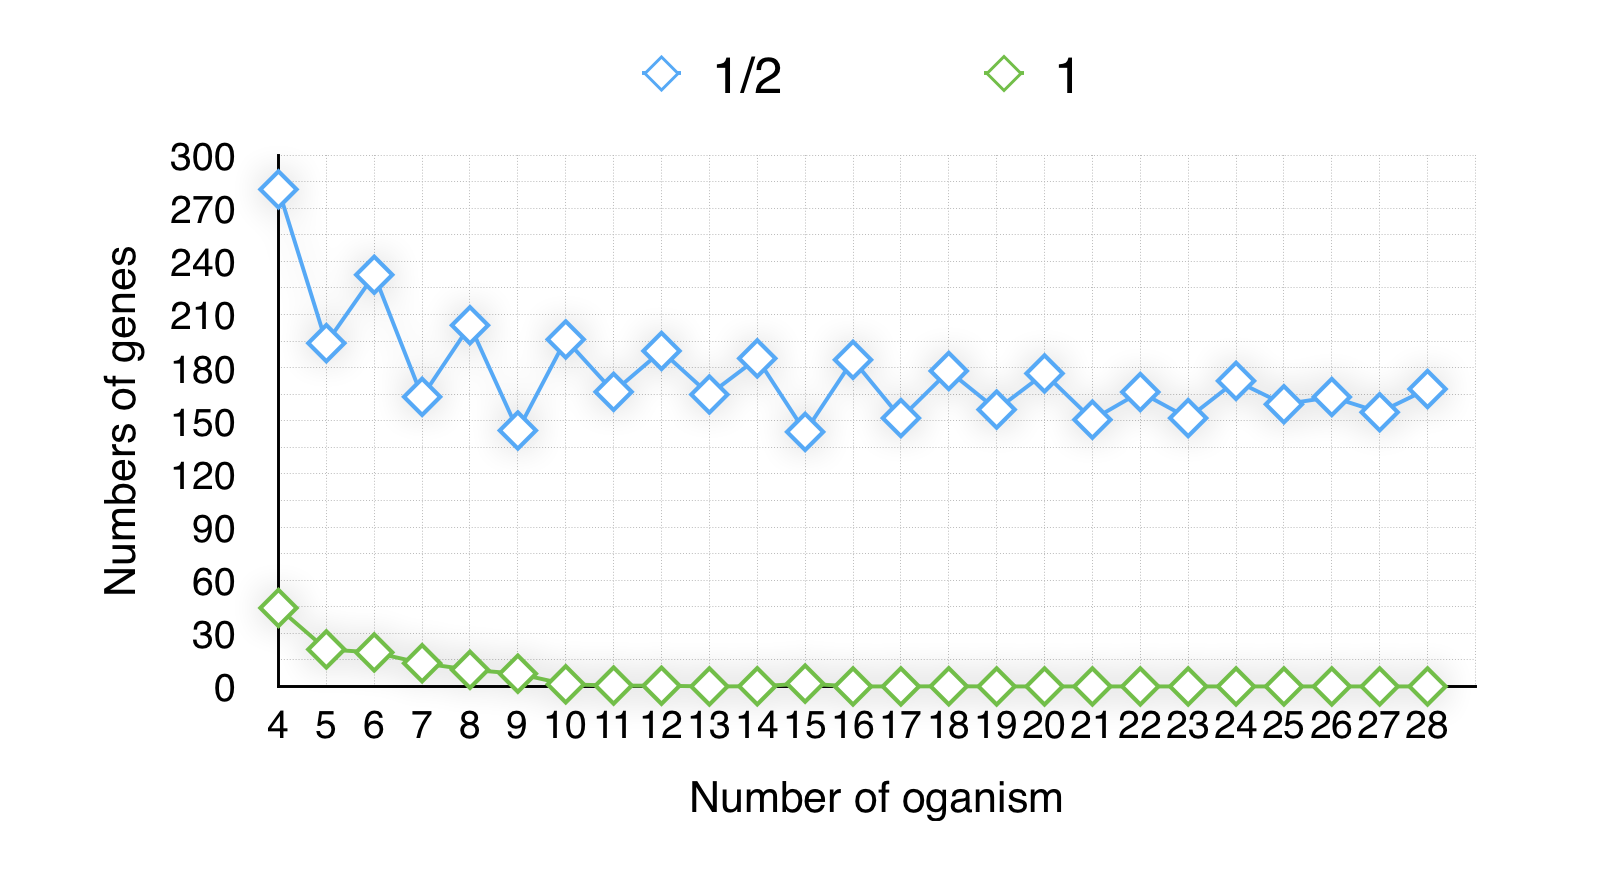
Obviously, the result of the half-retaining strategy seems more steady and more significant with the number of organisms’ increasing than the ubiquity-retaining strategy.
Secondly, to find the relationship between the HNR(Half Number Ratio) and the size of minimal-gene-set. We divide 100% into 100 groups (1%~100%). Now we have 100 groups and 25 experiments. Then we respectively get the experiment no.1~25’s size of minimal-gene-set in every group. And finally get line charts like Fig 1.2 and Fig 1.3(Cause there are too much data that we only list the 1/10,2/10~10/10’s results in Fig 1.2):
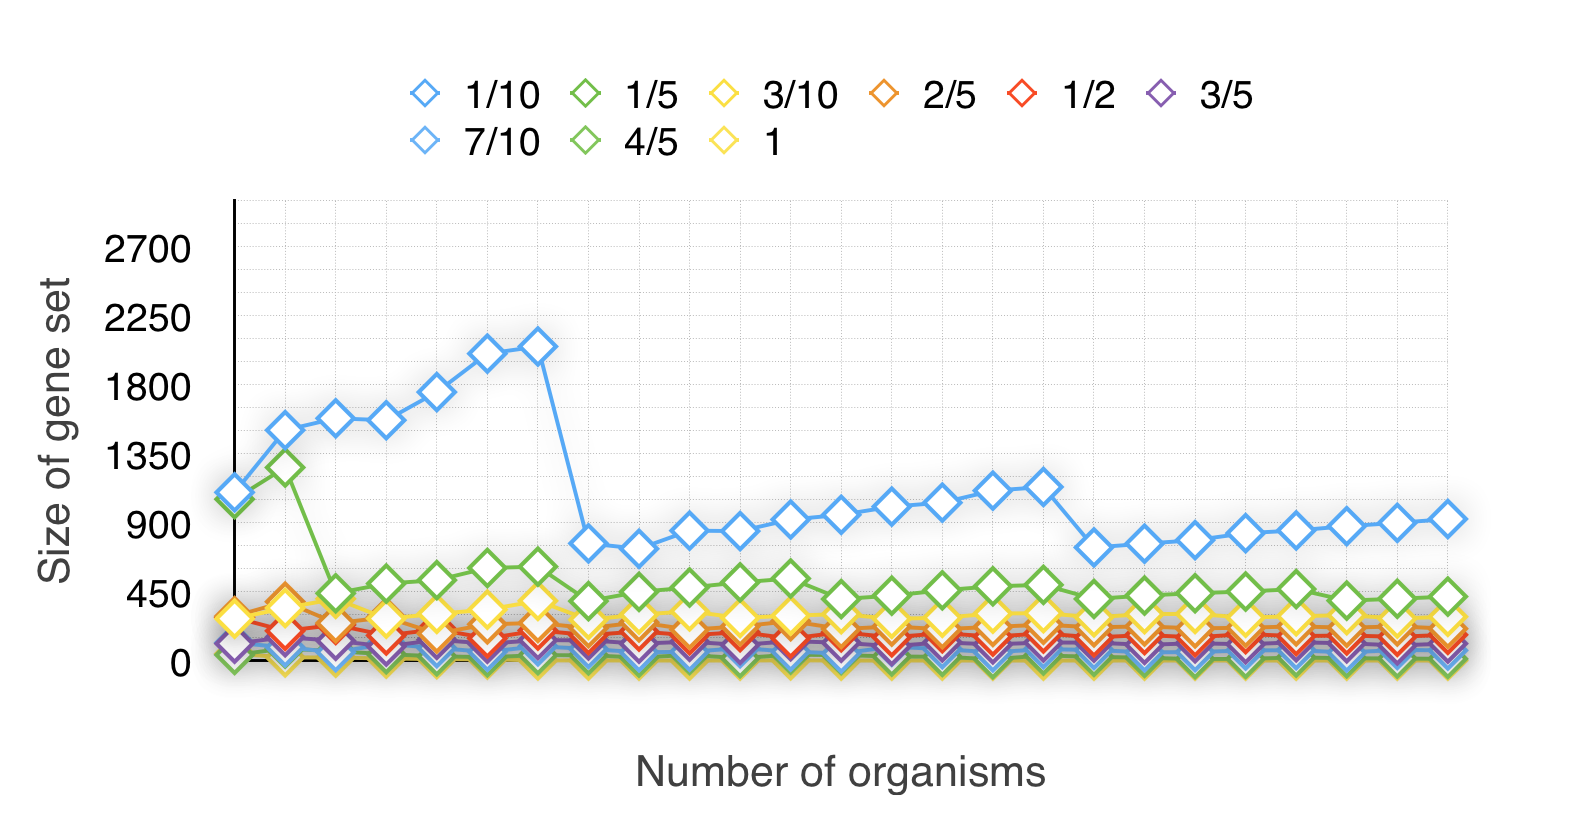
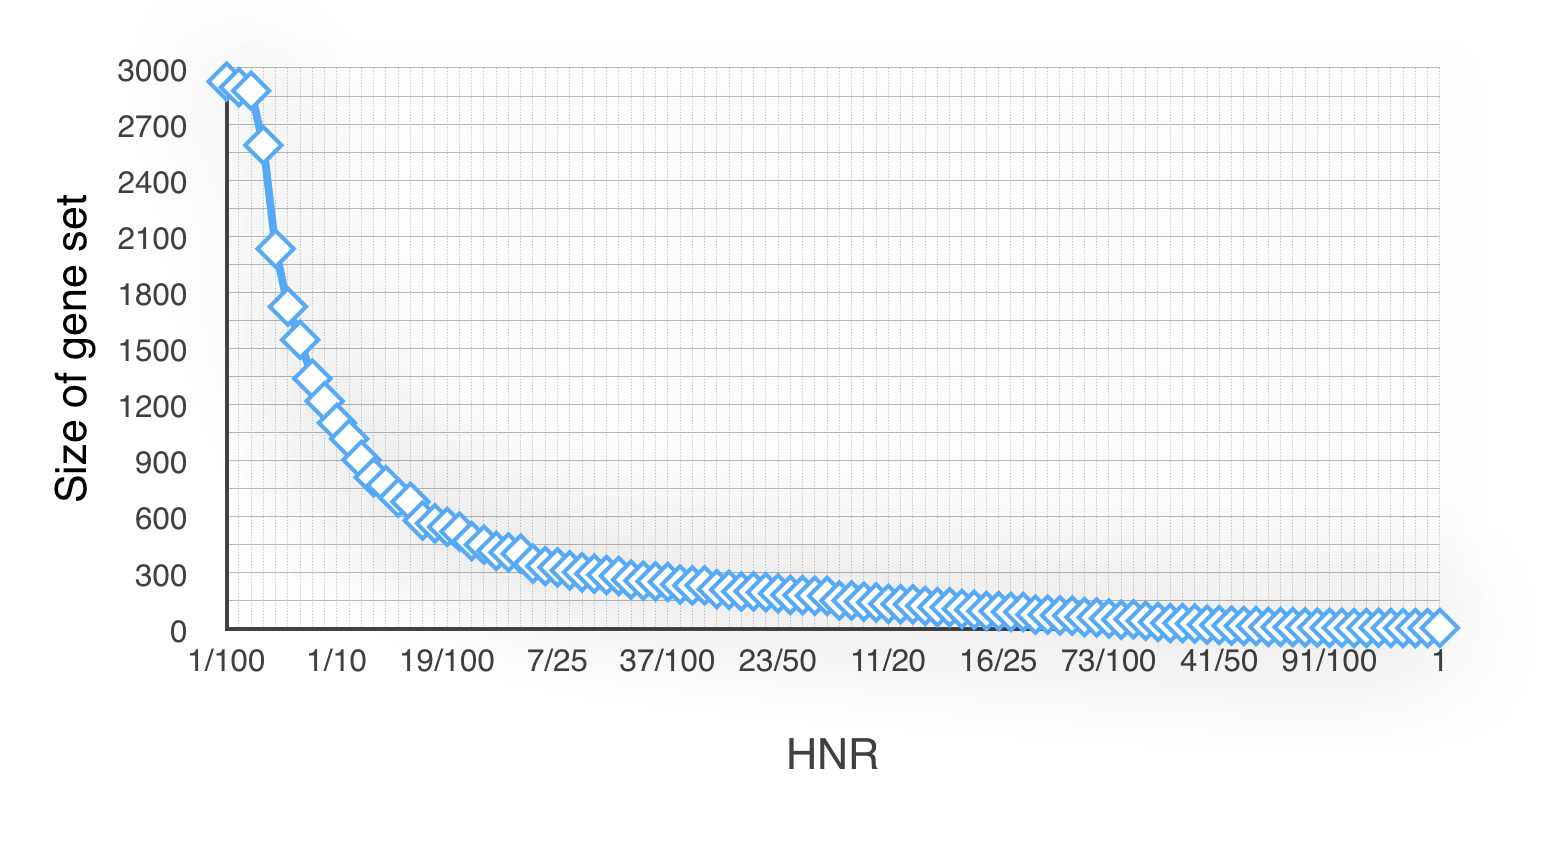
Our ideal size of minimal-gene-set is about 150~300. The conclusion is that the HNRs between interval [30/100~51/100] ’s size of minimal-gene-set are more close to the ideal amount.
Finally,To get a more particular knowledge of changing trend. We made a diagram to illustrate the relation of minimal gene set with number of organisms and HNR.
We use the least square method to get the fitting polynomial for every lines in the figure 1.2(100 polynomials here). We choose the 3 order polynomial. To get the 4 coefficients for the polynomial, we use the same method to get the relation of coefficient with the HNR. The 4 coefficients’ fitting polynomials are as follows:

The polynomial for the relation of the minimal gene set with number of organisms and HNR is as follows:

Now we have the polynomial to connect the relation of minimal gene set with number of organisms and HNR. The diagram is as follows:
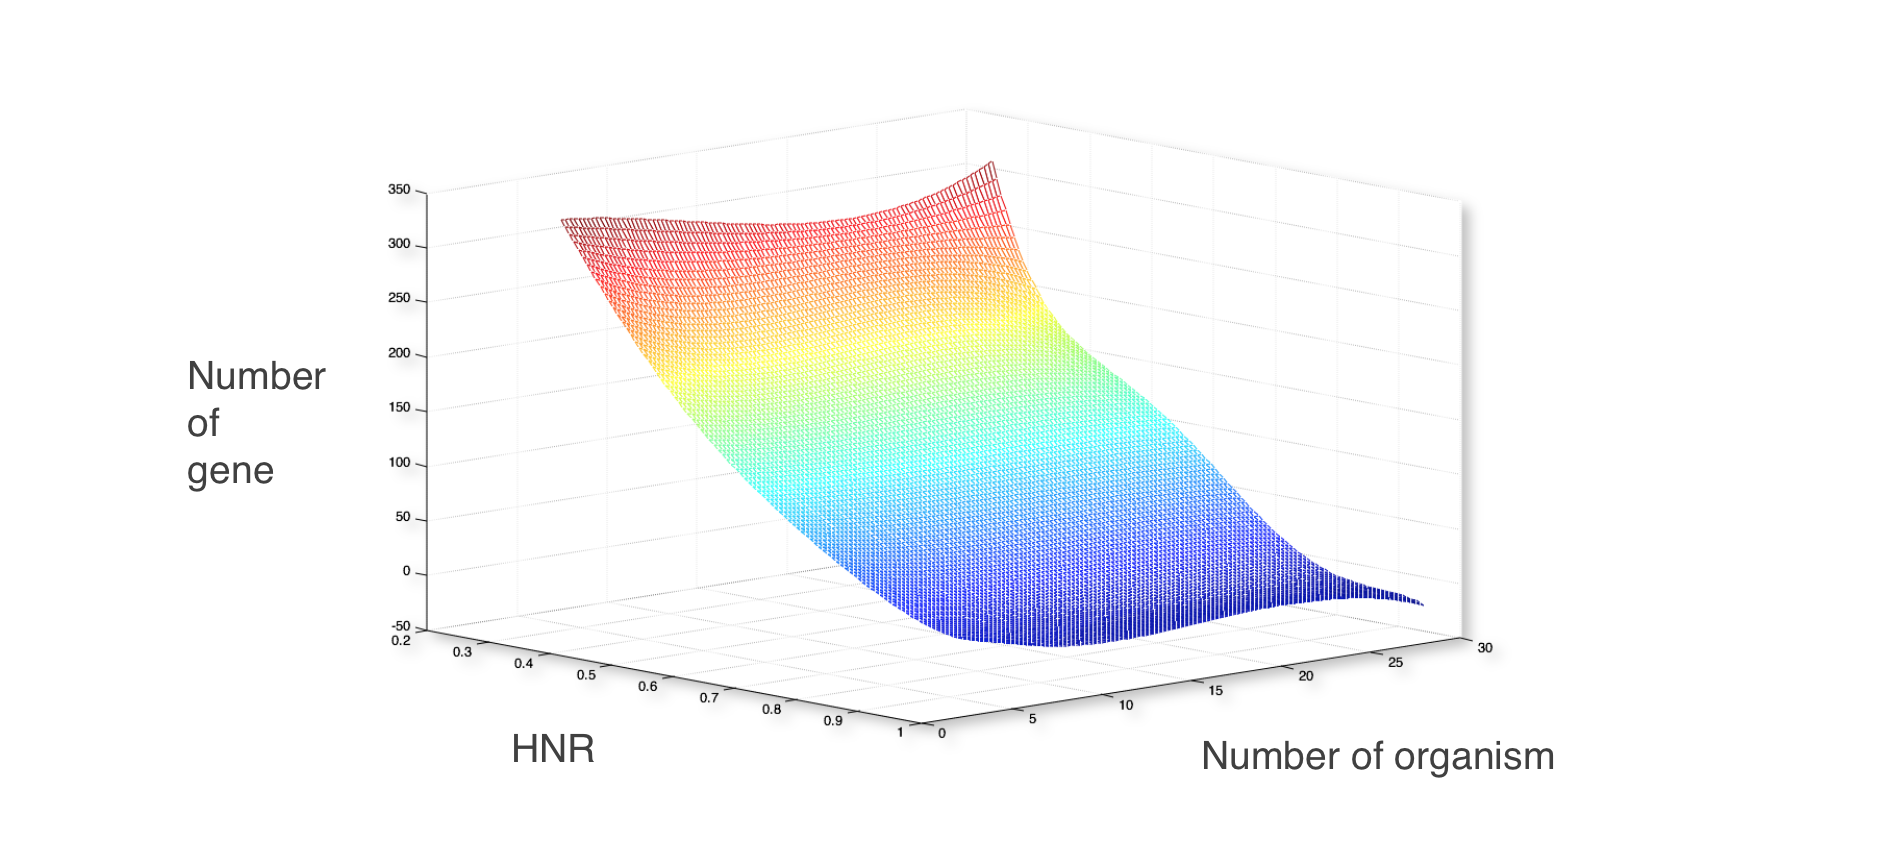
From diagram above, we found an area that have a stable gene number when organisms number changed. It means use these half number ratio can get a stable result of minimal gene set. But to find the most stable HNR for the “half” retaining strategy, let’s move to step 2.
Step 2
From the Step 1, we divided 100% into 100 groups (1%~100%). And we also have 25 experiments. Besides, before doing the experiments, we should define a new variable to measure whether the strategy is stable and effective. We call it OE rate( Overlapping Effective Rate). It’s calculated by this formula:

cUGS: the number of current experiment’s universal-gene-set-result
UGS29:the number of 29-organism-experiment’s universal-gene-set-result
This formula is to reduce the influence of the Gene’s amount. More OE rate means the strategy has a more sufficient result.
Now we have 100 groups and 25 experiments. Then we respectively calculate experiment no.1~25’s average of OE rate in every group. And finally get this line chart like Fig 2.1:
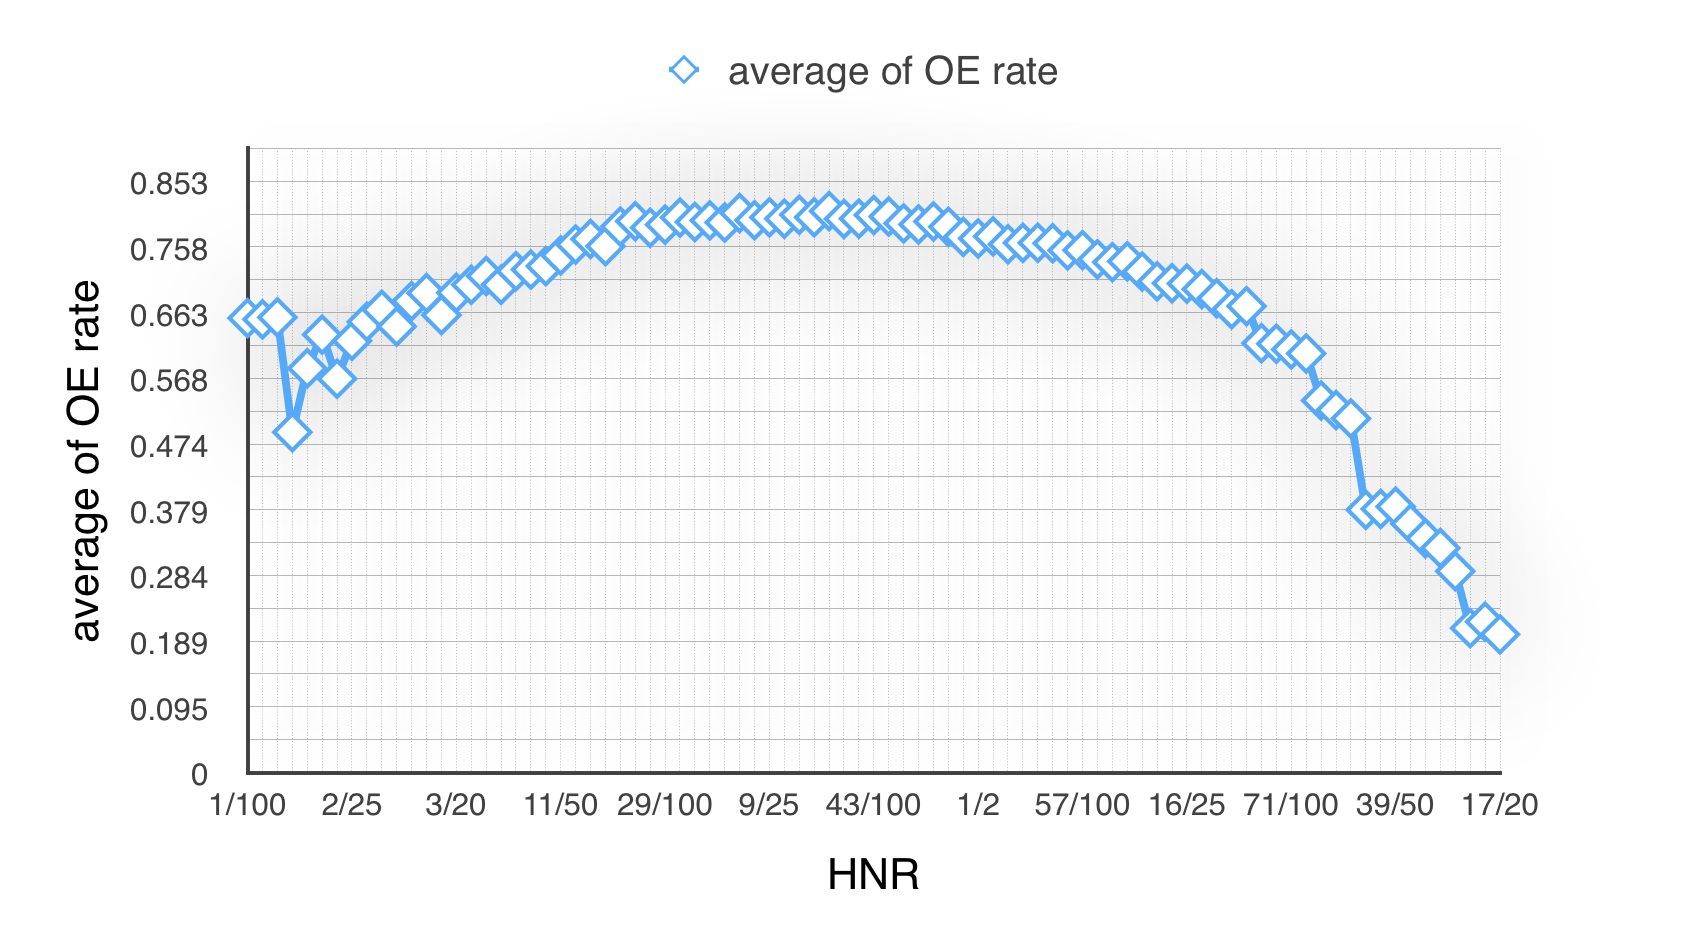
Obviously, we could find there are several groups has an ideal result, and also some unexpected results.
Next, we calculate experiment no.1~25’s variance in every group. Line chart as follow:
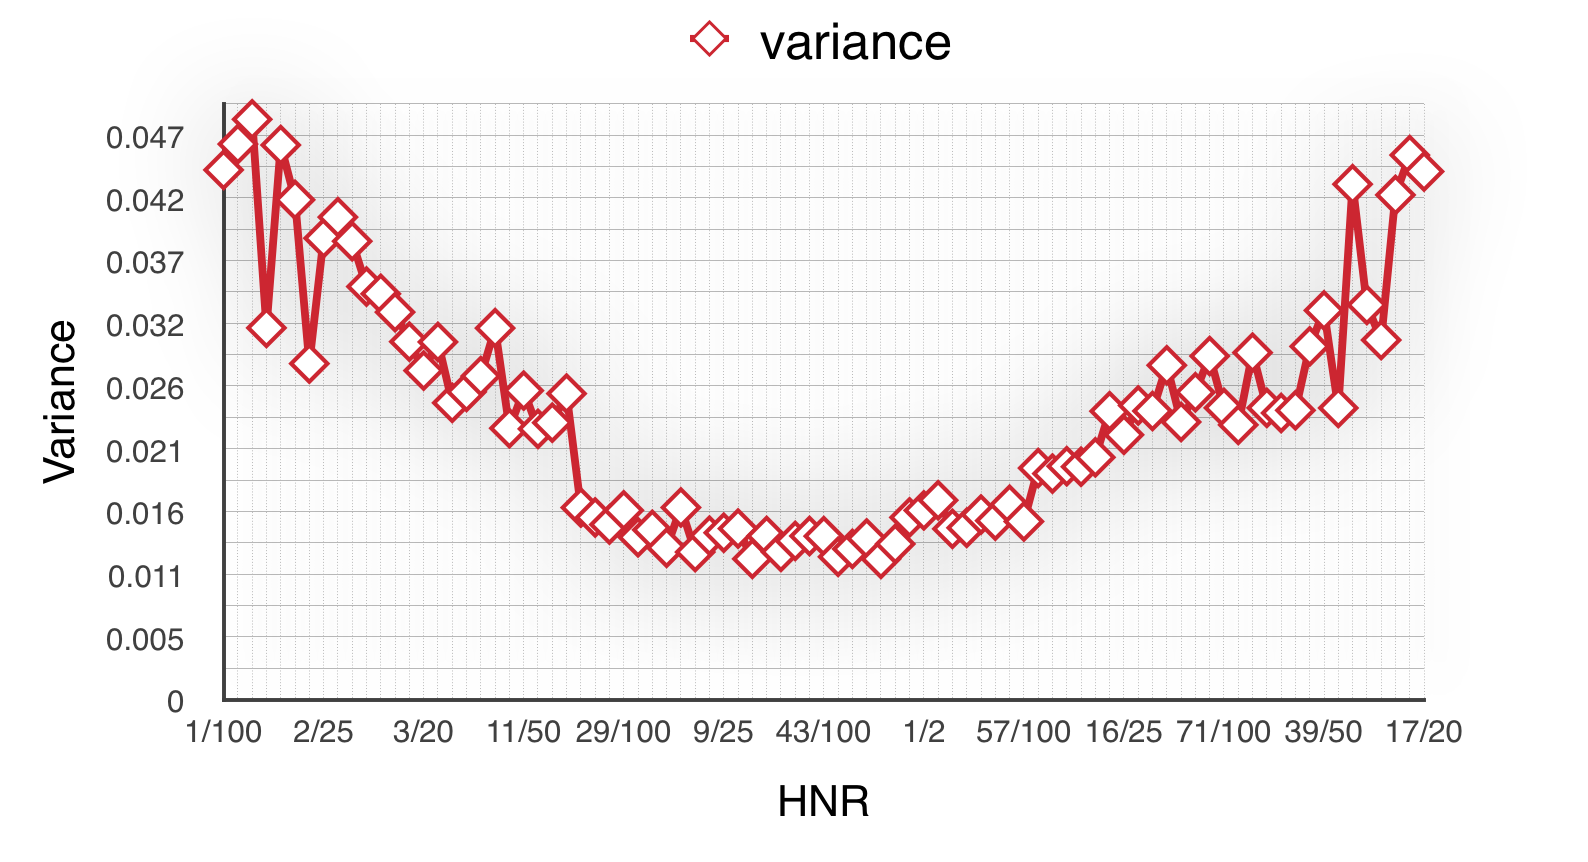
From the Fig 2.2, comparing the variances we could easily find the groups between 26/100~61/100’s variances are less than others which means strategy in this interval is more steady. It’s fortunate that we nearly get the same conclusion with the best interval mentioned in step 1.
Fortunately, we got a pretty results. We use the least square method to get the fitting polynomial. The new curve graph like this:

The polynomial is as follow:

After comparing the order of polynomial,we choose the 4 order polynomial. The correlation coefficient is 0.9703. According to the list. The polynomial is 97% to be accepted.
Next we calculate the maximization point as our ideal HNR (42%). That is how we define the ratio value of the retaining strategy.
Step 3
In step 3, we try to get the MCCAP’s calculating time. We test the experiment no.1~no.25(4 organisms ~ 28 organisms like step 1&2) in our 42% ratio retaining method to get the running time.
The bar chart is as follows:
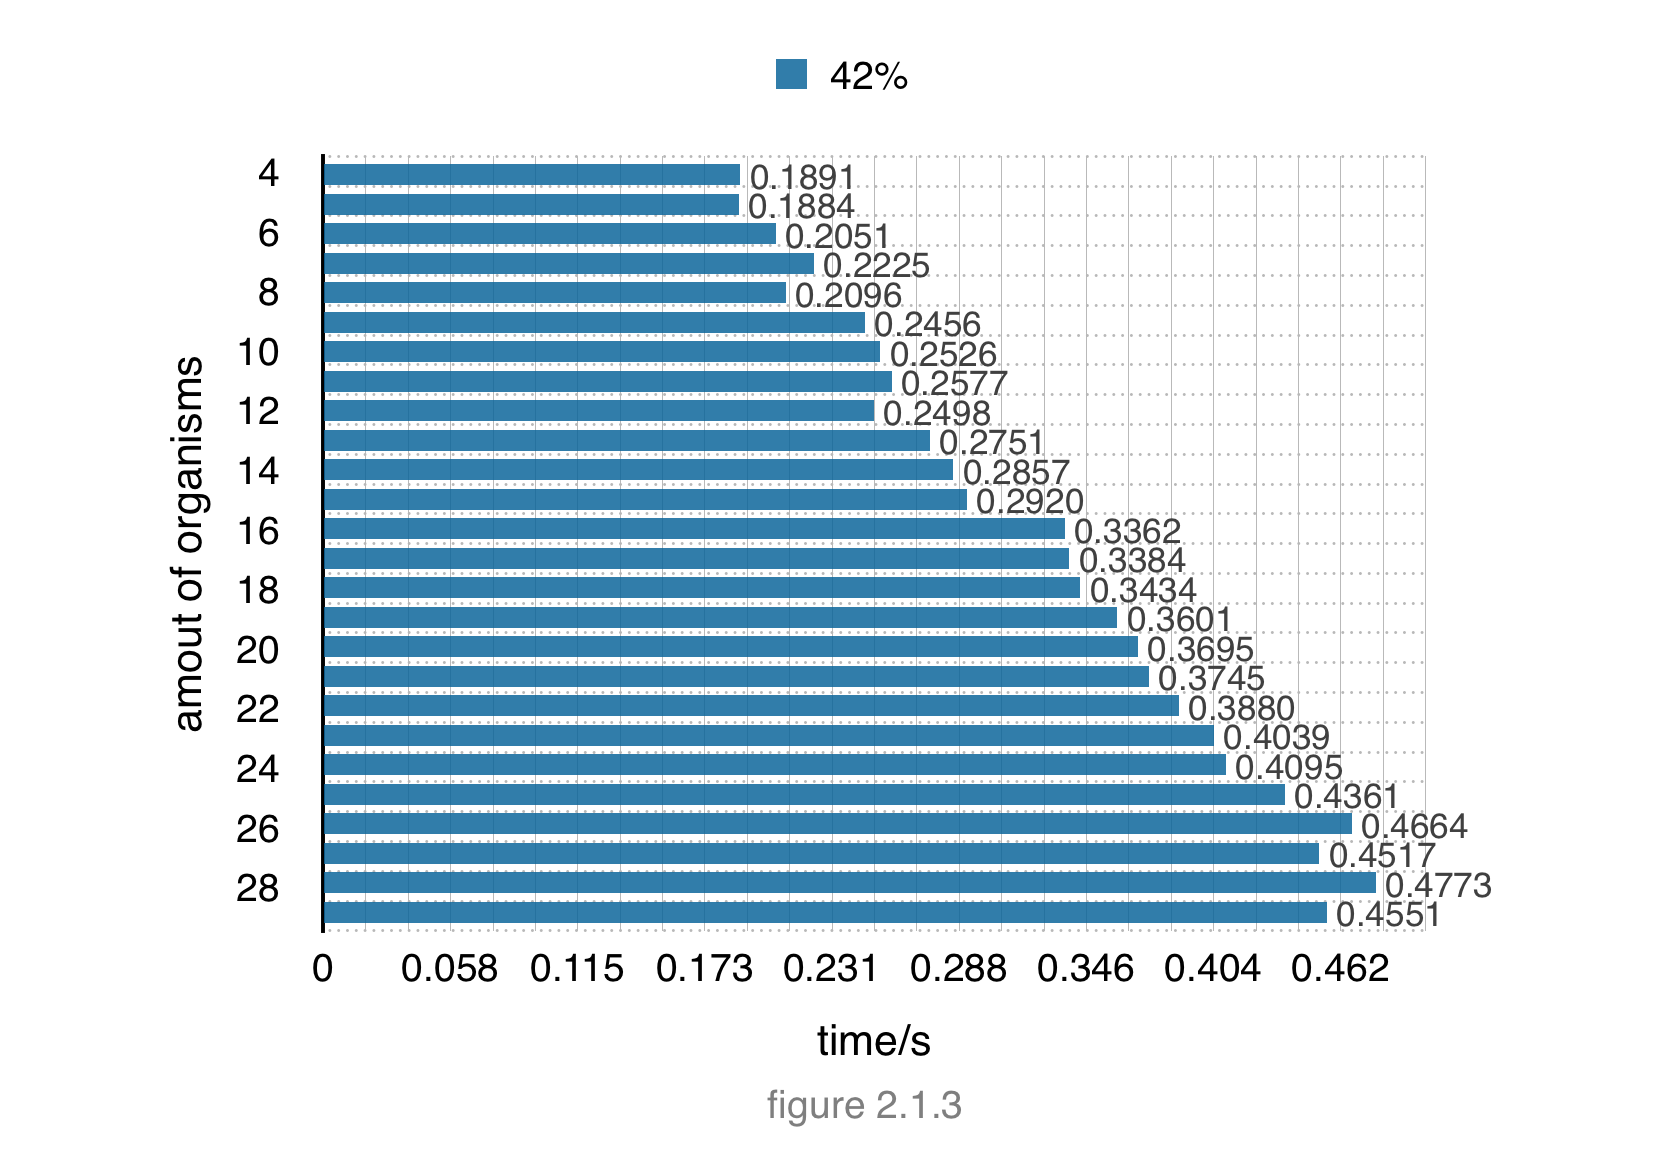
From the bar chart , as the increasing number of organisms, the running time increase gradually. But when we use all of the organisms from CEG data base. We still only spend less than 0.5s to get the results. The efficiency of MCCAP’s calculating can be accepted, and MCCAP did well in this aspect.
Validation
Step 1
We pick a organism from the 29 organisms(from no.1~no.29) one by one as 29 experiments . Then respectively use the remaining 28 organisms to screen the minimal gene set again and compare the results with the completed(29 organisms) one to get the overlapRatio.
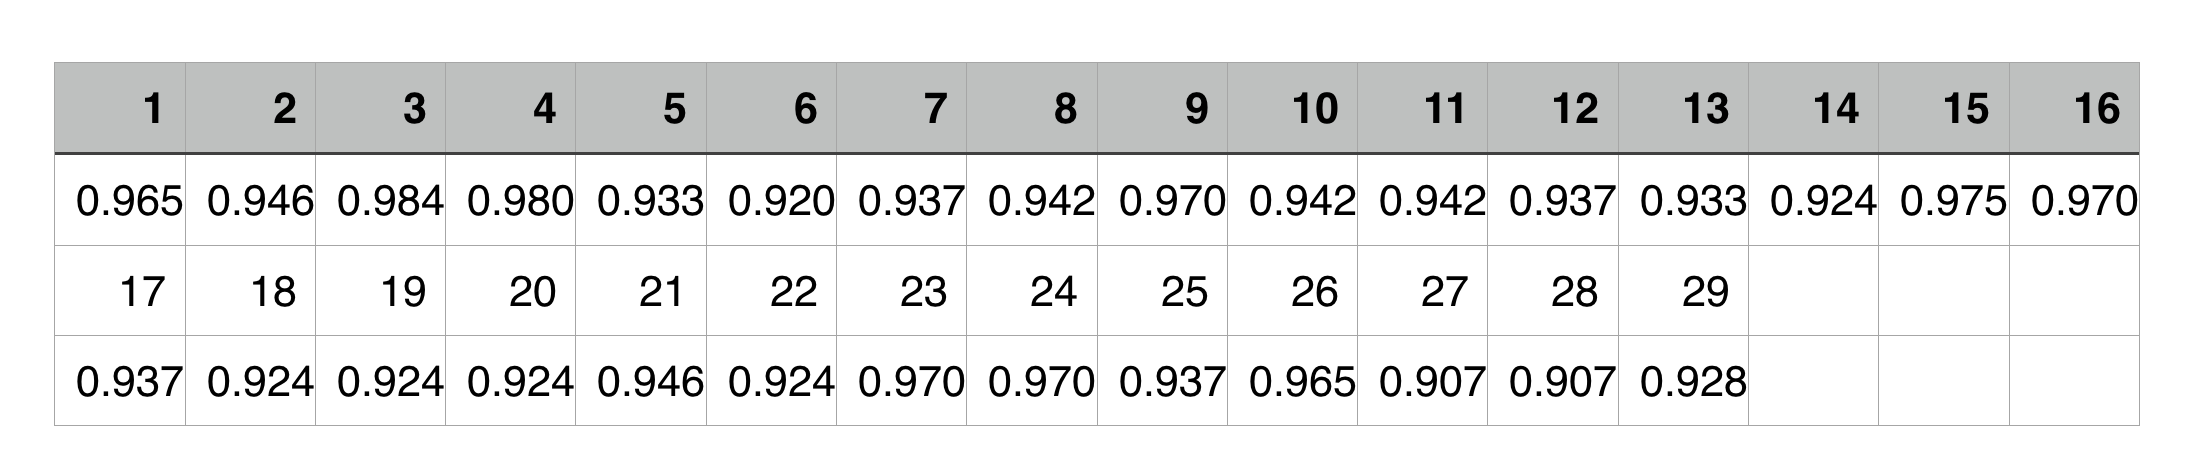
The line chart is as follow:

The variance of the overlapRatio is 0.000479
From the line chart and the variance, we could easily get a conclusion that all the experiments’ overlapRatios are more than 90% and vary slightly, which means our strategy is accurate and stable.
Step 2
Then let’s move to step 2. In step 1 we proved that our strategy is stable and accurate. Next, we compare the result with other two results(Gil, Mushegian&Koonin) which has got the minimal gene set by using other methods to prove our method is reliable and significant.

From the flow charts, unlike these two groups we have fewer genes in our minimal gene set, and have a higher overlap numbers for having 190 same genes with the Gil, and 156 genes with the Mushegian&Koonin’s result.Only 5 genes are different from other two groups. After this step, it’s obvious that our result is reliable and stable.
Reference
1.Yuan-nong Ye, Zhi-gang hua, Jian Huang, Nini Rao and Feng-biao Guo*: CEG: a database of essential gene clusters. BMC Genomics 2013
2.Roman L.Tatusov, Michael Y. Galperin, Darren A. Natale and Eugene V. Koonin*: The COG database: a tool for genome-scale analysis of protein functions and evolution
3.Mushegian AR, Koonin EV:A minimal gene set for cellular life derived by comparison of complete bacterial genomes. Proc Natl Acad Sci U S A 93, 10268-10273 (1996).