Team:UChicago/Measurements

Measurements
Characterization of pRha
One of the most significant design choices in our oscillator plasmid was the inducible L-rhamnose promoter (pRha). We based our choice by researching the characterization of a variety of different inducible promoters in the iGEM registry. The reason we chose this specific L-rhamnose inducible promoter, compared to a more standard IPTG inducible promoter was because the characterization for the L-rhamnose inducible promoter (Part:BBa_K914003), portrayed a more well characterized tight and graded response of pRha by the 2012 Paris-Bettencourt team. This leads us to believe that pRha is more suited to fine tune the concentrations of KaiA in order to investigate the KaiA : KaiC ratio in vivo.
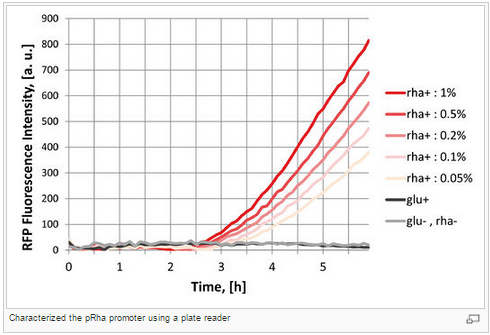
Figure H: Characterization graph developed by the 2012 Paris-Bettencourt Team.
For more details: http://parts.igem.org/Part:BBa_K914003
We conducted our own characterization of this Biobrick by tracking KaiA expression for a gradient of L-rhamnose percentages during a 10 hour induction (10 hour induction time was reported by the 2012 Paris-Bettencourt team). In order to track KaiA expression we used western blotting techniques as well as protein densitometry analysis in Image J. We believe our characterization is an improvement on the characterization accomplished by the 2012 Paris-Bettencourt team which used a plate-reader.
Induction for the characterization curve was accomplished in M9 minimal media with supplements (0.4%glycerol, 0.1% casamino acids).
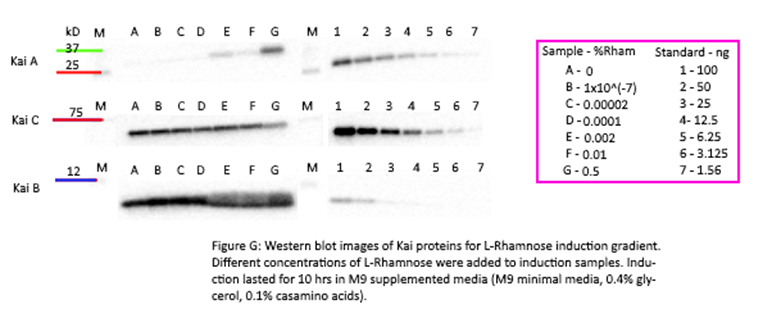
The results from our western blots indicate the tightness of pRha. At 0% L-rhamnose, there is significantly less KaiA expressed compared to KaiB and KaiC. This supports our ability to tune KaiA concentrations to optimize oscillations.
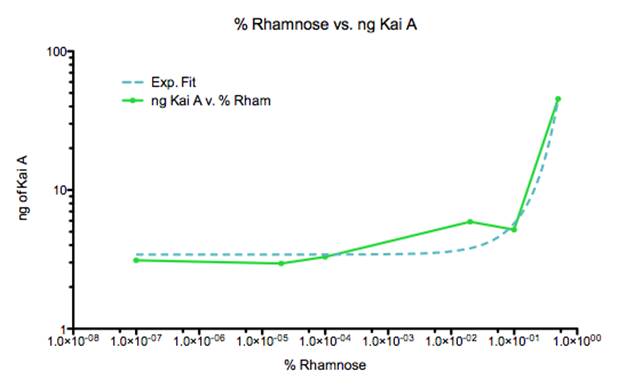
Figure I: Fitted exponential curve plotted in Prism to %Rhamnose vs. ng of KaiA gradient curve.
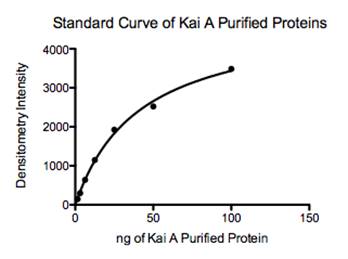
Figure J: Fitted standard curve of purified Kai A proteins to determine ng of protein from intensity readings in Image J.
|
Hours from Induction |
Calculated ng of KaiC |
|
2 |
3.687055366 |
|
4 |
2.502480912 |
|
6 |
3.739852542 |
|
8 |
2.385939102 |
|
10 |
3.229831071 |
|
12 |
1.601432251 |
|
14 |
1.617522393 |
|
16 |
1.838372276 |
|
17 |
2.212278744 |
|
22 |
2.806646524 |
|
62 |
1.882424045 |
Figure K: Raw data from induction time course experiment for KaiC.
The gradient curve we developed portrays the ability to fine tune the concentrations of KaiA. The data in this graph was corrected using ng from protein standards (Figure J). Ideally, we would have run multiple such assays, with a higher gradient of L-rhamnose than listed above. However, the data presented gives us a good start to characterizing a usable gradient of KaiA expression. Given our previous data, in which KaiC levels varied from a range of 1.6-3.7 ngs, we can ballpark the %Rhamnose to investigate to be from 1-0.0001%.
Like our team Facebook page, Genehackers@UChicago!
Questions? Comments? Send us an email!