RESULT
TOXIN MANUFACTURE
1. TOXIN PROTEIN:
To ensure the successful establishment of the toxin plasmids, we gel electrophoresed both the single and double digestion product of cloned mCherry (CDS), plu1537 (Device) and plu0840 (Device) shown as below.

Fig 1. Engineered toxin protein circuit-1 (single and double digestion)

Fig 2. Engineered toxin protein circuit-2 (double digestion)
Red colonies in plates were found which shows the successful expression of the mCherry after being cultured in solid LB with 80mM/L arabinose 24 hours after plate coating.

Fig 3 Engineered bacteria mCherry on plates

Fig 4 Engineered bacteria mCherry in pipets
For further verification of the protein expression, we coomassie stained our product and saw obvious expression of targeted site of the mCherry, plu1537 and plu0840 (see lane1, lane6 and lane7), but no obvious expression band was found for tcdA1 (see lane 8). From lane2 to lane5 we could only see significant result in lane4 where high expression of mCherry might occur.

Fig 5 Expression of our toxin protein
2. Avermectin overexpression
To overexpress the avermectin in Streptomyces avermitilis
We first successfully PCR our two target gene—the metK & orfX, which shows its function in improving the expression of avermectin, shown as Fig 6. PCR products are indicated. (See Protocol)

Fig 6. Successful PCR product of metK and orfX.
2.2 We then constructed our target gene into TA clone plasmid PMD-19T (See fig 6) and then transformed them into our conjugation transferring plasmid PL96 and PL97 (see fig 7). Digested plasmid backbone and target fragments are indicated. (See Protocol)

Fig 7. metK and orfX in TA clone plasmid PMD-19T

Fig 8. metK and orfX in conjugation plasmid PL96 and PL97
2.4 We finally transformed our gene from a donor strain—E.coli ET12567 (a methylation defective strain) and the recipient strain—S. avermitilis with efficiency of approximately 1e-6. (!!!!!!!!!!See protocol!!!!!!!!!!!)

Fig 9 Engineered S. avermitilis on plates
Results and Discussion(CNC)
In this page, we will show all of our experimental results about CNCs and evaluate the experimental situation. By doing this, we attempt to find a direction to improve our research in the future.
Preparation of CNCs
According to the quenching effect from 10-fold cold DI water, we got the raw product solutions (Figure 1). With abundant raw cellulose fibers existing, the solutions are a little turbid.

Figure 1 raw CNC solutions
Then, after centrifugation, we prepared the CNC Suspension. We used red laser pointer to irradiate DI water and the CNC Suspension, respectively, and only the CNCs forms the Tyndall effect, which proved the existence of CNCs conveniently. (Figure 2)
Freeze-drying to get final product
After overnight freeze-drying process, we got the final product CNCs in the end. (Figure 3)
Thermal Gravimetric Analyzer (TGA)
TGA was carried out to observe the thermal characteristics of the CNCs (Figure 4). Evaporation of water led to the first stage of gradual weight loss. The onset temperature which CNCs began to degrade was around 223 ℃. The most obvious weight loss occurred at 393 ℃ while the literature value is 313 ℃[1], indicating the high thermal stability of CNCs we made.

Figure 4 TGA analysis of CNCs
TEM and SEM observation
The pure CNC will crystallize in aqueous solutions and thus forming a square shape (Figure 5), which can be a standard to recognize whether bacteria are embedded in the CNC.

Figure 5 TEM images of CNCs
In the Figure 6a, 6b taken under TEM, it’s obvious that the fibers of CNC are attached to the surface of E.coli, which reveals that the CNCs have successfully wrapped E.coli. Meanwhile the profile of CNCs has been displayed in Figure 6c, its sphere is extremely smooth while that of CNCs with E.coli is relatively rough. The red arrow of Figure 6d clearly indicates the location of E.coli.

Figure 6 TEM and SEM observation with E.coli
In same process, we observed the embedding situation of Streptomycete as well. In the Figure 7b, different from the pure Streptomycete which has smooth fibers (Figure 7a), the embedding in CNCs results in Streptomycete’s surface having abundant granular substance (CNCs). On the other hand, the size of Streptomycete colony were extremely expanded after the embedding in CNCs (Figure 7c, 7d), which further revealed the success of embedding.

Figure 7 TEM and SEM observation with Streptomycete
The images of Figure 8 show the growth of the CNC fibers. During the freeze-drying process, water infiltrated into the CNCs microspheres and formed multiple hydrogen bonds with CNCs, which caused the formation of mischcrystal under low temperature and had a structure of three-dimensional network. Water sublimated during freeze-drying so the porous CNCs skeleton was left. Therefore, we observed that the fibers formed by CNCs became more and more coiled while more and more slimy matters were adhered to the surface of the fibers with the increasing amount of bacteria. These proved the bacteria were embedded into the CNC fibers and had an indirect influence on the features of CNC fibers.

Figure 8 CNC fibers with E.coli
Dynamic Light Scattering (DLS)
The Figure 9 reveals the embedding situation of E.coli with CNCs. E represents the pure E.coli. 4 h-CNC-E represent the microsphere of E.coli with CNCs. CNC is the microsphere with E.coli which has been stored in 4 ℃ for 20 days, and we guess the E.coli are dead and the CNC shell collapsed inward.

Figure 9 Dynamic Light Scattering of E, CNC and 4 h-CNC-E
The Figure 9 indicates that 4 h-CNC-E occurs obviously self-assembly in general. The average particle sizes of each kind of compound are shown on the Table 1.
Through simple subtraction, we can get the thickness of CNC on the surface of E.coli:
Thickness = (1513.8 – 1317.1)/2 = 0.9835 nm
Reference
1 Zhou, J. et al. Synthesis of multifunctional cellulose nanocrystals for lectin recognition and bacterial imaging. Biomacromolecules 16, 1426-1432, doi:10.1021/acs.biomac.5b00227 (2015).
TERMITES
Bait attractiveness
Our experiment shows that the bait we use is strongly attractive to termites. When facing with baits and normal wood, termites will always choose our baits. This ensure that our device will successfully attract the termites even there is many other food.

Fig 1. Wood powder has been placed in the petri dish for 10 min. (A) 0 min after baits added. (B) 1 min after baits added. Termites begin to move to the baits. (C) 5 min after baits added. Most termites are surrounding around the baits.
Chosen compound toxicity verification
We prove that Avermectin and the mix of our toxic protein are both toxic to termites. Using the Streptomyces and TT01, the Avermectin seems to work better.

Fig 2. Toxicity verification of Avermectin and toxic protein. Avermectin works well at killing termites.
Cellulase and lysozyme activity measurement
When worker termites are taking the food back to their nest, they will keep the food in their mouth. According to our result, the cellulose activity in termites’ head is relative low. This guarantee that our CNC coat will not be totally digested for a certain period of time. The relative high cellulase and lysozyme activity in gut ensure that our coated bacteria will be digested when finally eaten.
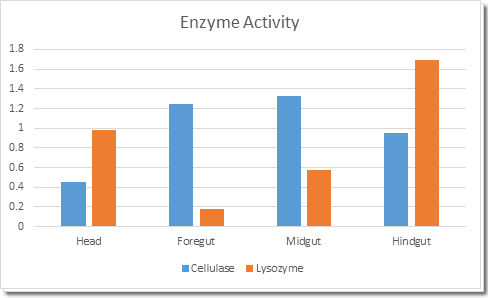
Fig 3. Cellulase and lysozyme acticity in different parts of termites gut.
Verification of the release delay effect due to the CNC capsulation
After the CNC capsulation, the termites will not die as soon as before because they need to digest the CNC coat first. This results in a period of time for termites to conduct trophallaxis.

Fig 4. CNC capsulated Streptomyces toxicity compared with the no capsulated one.
Trophallaxis verification
In order to see whether trophallaxis has happened or not, we choose to observe the soldiers termites because the only way for them to get food is through the trophallaxis. We dye the food with certain color and termites that eat these food will turn into corresponding colors.

Fig 5. The leftmost termite arrow pointed is the normal termite. Other termites with arrows indicates the blue dyed termites.

Fig 6. Dyeing for two days. Workers termites become extremely blue. Meanwhile, soldiers become blue. This indicates that trophallaxis has been carried out.

Fig 7. A blue soldier termites are placed with two red worker termites (cannot see in this picture). Red staining food are also provide. Three days after, the soldier shows a little bit red color (the lower one). The control one added is still really blue.
Gene modified product effectiveness measurement
We have successfully expressed the toxic protein in E.coli. Using E.coli, we test the toxic protein toxicity again. This time, toxic protein shows a strong effectiveness to kill termites.

Fig 8. Toxicity verification of modified E.coli.