Team:KU Leuven/Modeling/Internal/Ultra/Test5

Internal Model
1. Introduction
In designing new circuits and implementing them, it is important to model the effect of it on the bacteria: how sensitive is the system, how much will it produce and will it affect the growth? These questions can be answerred in the internal model. We will use two approaches. Flux Balance Analysis (FBA) will study the steady-state values for production and growth rate, while Simbiology will study the sensitivity and dynamic processes in the cell.
2. Simbiology
In the next section we will describe our Simbiology model. Simbiology allows us to calculate systems of ODE's and to visualize them in a nice diagram. It also has options to make scans for different parameters which allows us to study the effect of the specified parameter. We will focus on the production of leucine, Ag43 and AHL in cell A and the changing behavior of cell B due to changing AHL concentration. In this perspective, we will make two models in Simbiology: one for cell A and cell B.
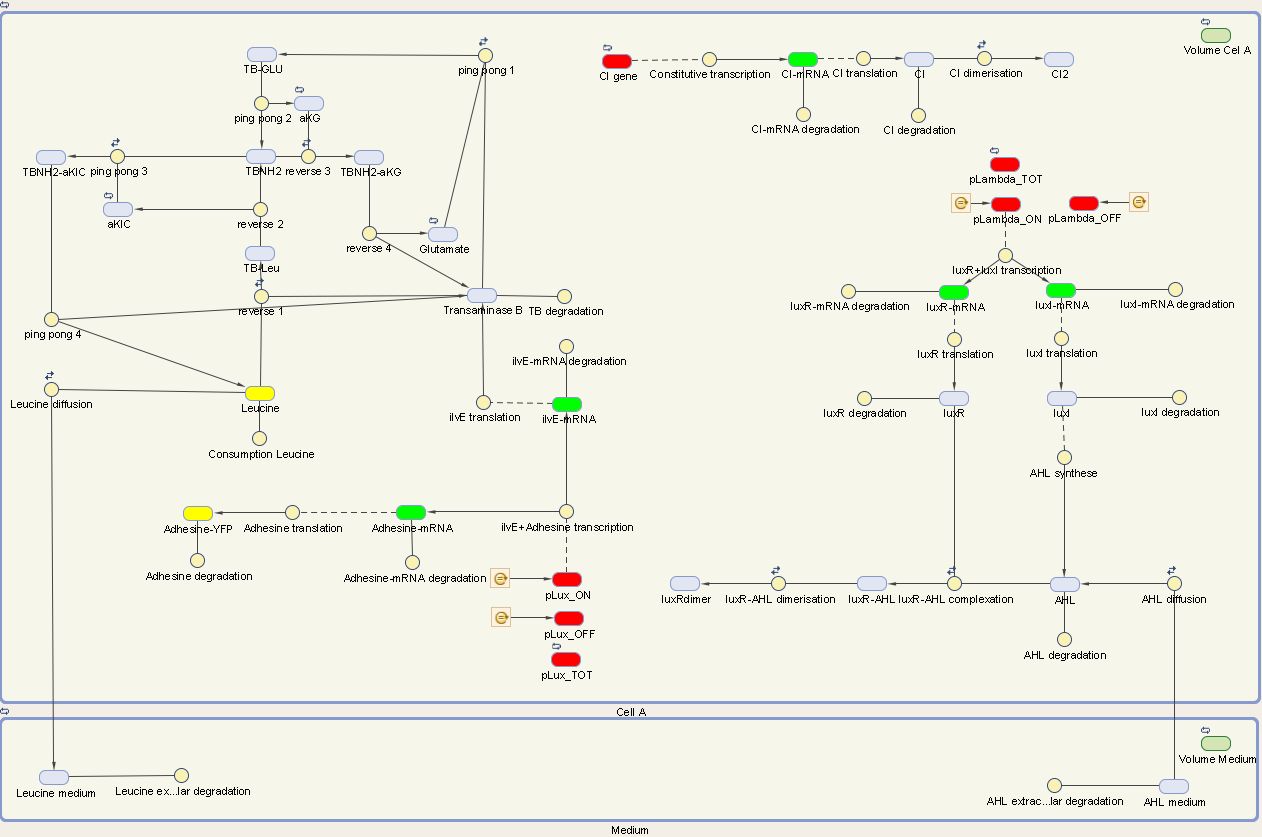
2.1 Cell A
The designed circuit in Cell A is under control of a temperature sensitive cI repressor. Upon raising the temperature, cI will dissociate from the promoter and the circuit is activated. This leads to the initiation of the production of LuxR and LuxI. LuxI will consecutively produce AHL, which binds with LuxR. The newly formed complex will then activate the production of Leucine and Ag43. Leucine and AHL are also able to diffuse out of the cell into the medium. Ag43 is the adhesine which aids the aggregation of cells A, while Leucine and AHL are necessary to repel cells B.
We can extract the following ODE's from this circuit (the used functions will be explained later on):
${\alpha}$:transcription term, ${\beta}$:translation term, ${d}$:degradation term, ${D}$:diffusion term
${K_d}$:dissociation constant, ${n}$:hill coefficient, ${L}$:leak term
$$\frac{{\large d} m_{cI}}{d t} = \alpha_1 {\cdot} cI_{gene} - d_{mCI} {\cdot} m_{cI}$$
$$\frac{{\large d}{cI}}{d t} = \beta_{cI} {\cdot} {m_{cI}} -2 {\cdot} {k_{cI,dim}} {\cdot} {cI}^2 + 2 {\cdot}{k_{-cI,dim}}{\cdot} {[cI]_2} - d_{cI} {\cdot} {cI}$$
We visualize these ODE's in the Simbiology Toolbox which results in the following diagram:
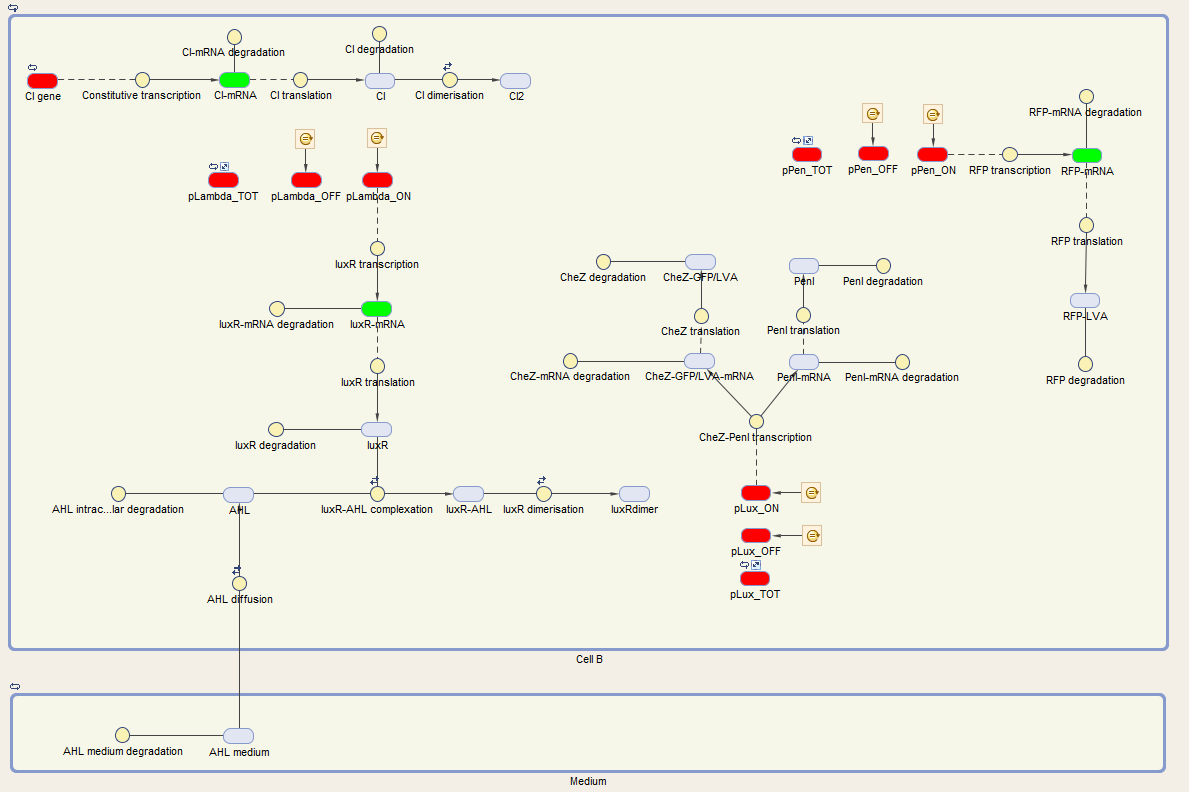
2.1 Cell B
The system of Cell B is also under control of the cI repressor and is activated similar as cell A. The activation by the temperature raise, leads to the production of LuxR. AHL of the medium can diffuse into the cell, binding LuxR and activating the next component of the circuit. This leads to the production of CheZ and PenI. CheZ is the protein responsible for cells to make a directed movement, governed by the repellent Leucine. PenI is a repressor which will shut down the last part of the circuit which was responsible for the production of RFP.
We can extract the following ODEs for Cell B from this sytem:
$$\frac{{\large d} m_{cI}}{d t} = \alpha_1 {\cdot} cI_{gene} - d_1 {\cdot} m_{cI}$$
$$\frac{{\large d}{cI}}{d t} = \beta_1 {\cdot} {cI} -2 {\cdot} {k_{cI,dim}} {\cdot} {cI}^2 + 2 {\cdot}{k_{-cI,dim}}{\cdot} {[cI]_2} - d_{cI} {\cdot} {cI} $$
We visualize these ODE's in the Simbiology toolbox. This gives us the following diagrams:
3.Quest for parameters
We can divide the different processes going on in the cells in 7 categories: transcription, translation, DNA binding, complexation and dimerization, protein production kinetics, degradation and diffusion. We went on to search the necessary parameters for each of these categories.
3.1 Transcription
Transcription is the first step of gene expression. It involves the binding of RNA polymerase to the promoter region and the formation of mRNA. The transcription rate is dependent on a number of conditions like the promoter strength and the used strain. The prediction of the transcription rate has been an important hold-back in the past, even though Polymerases per Second was introduced as a unit. This is the amount of Polymerases that passes through a given position in the DNA per time unit and is essentially the transcription rate at a particular location on the DNA (open wetware http://openwetware.org/wiki/PoPS). It remained difficult to measure in vivo but Kelly et al have introduced a way to measure the activity of promoters using an in vivo standard, promoter J23101. This gave rise to a new unit: Relative activity of promoter (RPU)$=\frac{PoPS_{phi}}{PoPS_{J23101}}$. By using relative units, the variability due to equipment and conditions was drastically decreased. The PoPS of J23101 was found to be 0.03.
As our constitutive promoter, we used J23114. On the iGEM website we found that the J constitutive promoter family had been characterized using RFP and we found that J23101 had a strength of 1791 au and J23114 had a strength of 256 au with J23112 as standard in this measurement. We conclude that J23114 has a PoPS of 0.00429. The iGEM team of UNIPV-Pavia 2010 also measured the activity of J23114 in E. coli in LB with a high copy number. The RPU is equal to around 0.05. This means that J23114 has a PoPS of 0.0015. The two values are of the same magnitude but we take the smaller one, since we can not find the references of the first measurement and to play on safe.
The strength of the pLuxPR promoter has been measured relatively to pLacIQ by iGEM Tokyo_Tech 2010. They found a value for pLuxPR of 550 and for pLacIQ of 390. pLacIQ has also been measured by iGEM Upssala university 2012 and was found to have a RPU of 0.04 giving it a PoPS of 0.0012. From these values we calculate the PoPS of pLuxPR to be 550/390 * 0.0012 =0.00169 PoPS. We can also find a leak term in their measurements. Without AHL and LuxR, the pLuxPR was active and had a RPU of 10. This means that the leaking promoter has a PoPS of $\frac{10}{390} {\cdot} 0.040 {\cdot} 0.03 = 3.077 {\cdot} 10^{-5} PoPS$.
We then sought values for pCI. Measurements 2009 iGEM NYMU-Taipei measured the pLux promoter relative to pCI, which allows us to calculate the PoPS for pCI: $\frac{1}{0.43} {\cdot} 0.00169=0.0394$ PoPS. Their resulst of pPen were not consistent and the team mentioned they lacked experience in the beginning. Results of the earlier used pCI and pLux were consistent though. This is why we only used their last results and took the mean of pPen compared to pTet: $(0.801 {\cdot} 0.537 + 0,191) {\cdot} {\frac{1}{2}}=0.3106$. Using this mean value we were able to calculate the PoPS: $0.3106 {\cdot} 0.0394=0.01224$.
These values all depend on measuring activities and since the strains, media and antibiotic markers won’t be completely the same, the real values will diverge from the values found with these simple calculations. These values can give us an idea about the relative strength of the different promoters. We could gather the real values of mRNA concentration in our cells by executing a qPCR but for now we will use the found values for our model.
The last important parameter for transcription is the copy number in which the genes are present in the cell. The plasmid that incorporates the used genes, has an ORI with a copy number between 100 and 300. In our model we will use a copy number of 200.
3.2 Translation
The next step in gene expression is the translation of the synthesized mRNA to a protein. This involves the binding of a ribosome complex to the RBS site of the mRNA, elongation and termination. The initiation step is the rate-limiting step of the three. The translation rate is thus tied to the thermodynamics of RBS-ribosome interaction but other sequences (5’-UTR, Shine-Delgarno,repeats, internal startcodons) and possible secondary structures (hairpins) also play a role (Chiam Yu Ng, Salis). (Fong) Salis et al have developed an algorithm to predict the translation initiation rate based upon thermodynamic calculations. This algorithm is used in the Ribosome Binding Site Calculator (https://salislab.net/software/ , Borujeni & Salis). We used this Calculator to predict the translation rates of our mRNAs.
The results are in table 1. The program gives us results in au (arbitrary units). Since we know the translation rate of LuxI and LuxR, we can use these as a base to calculate the other translation rates since the used scale is proportional. (table 1, column 2) LuxI and LuxR have almost the same output from the calculator which corresponds with the paper where they also have the same translation rate. (Ag43 has a very low translation rate, which is not completely illogical, since Ag43 is by far the biggest protein.) Our values are normal values since 1000 is a moderate value and values between 1 and 100 000 are possible. (efficient search, mapping and optimization, salis). We did get warnings about the prediction (NEQ: not at equilibrium) which happens when mRNA may not fold quickly to its equilibrium state.
| Protein | Translation rate (a.u.) | Translation rate (1/s) |
|---|---|---|
| LuxI | 261.13 | 0.016 |
| LuxR | 279.61 | 0.016 |
| cI857 | 5695.79 | 0.35 |
| Transaminase B | 2195.1 | 0.13 |
| Ag43-YFP | 33.22 | 0.0020 |
| PenI | 6696.73 | 0.41 |
| RFP | 2604.51 | 0.16 |
| CheZ-GFP | 396.95 | 0.024 |
3.3 DNA binding
Our system includes two types of DNA binding proteins: repressors and activators. These proteins bind certain regions in the promoter DNA. This binding can either repress or activate the promoter activity, affecting transcription. The repressors used in our system are the cI protein of the lambda phage and the PenI protein. The activator protein is LuxR, which should be activated by AHL. All proteins first need to form homodimers before being able to bind their target DNA.
DNA binding will be simulated using the Hill function : ${\theta} = \frac{{[L]}^n}{{K_d}^n + [L]^n} = \frac{1}{1+(\frac{K_{d}}{[L]})^{n}}$. $\theta$ is the amount of DNA bound by the protein, $L$ is the amount of protein, $K_d$ is the dissociation constant and $n$ is the Hill coefficient.
For repressors we are interested in how much of the DNA is still unbound and active:
$\frac{1}{1 + ({\frac{[Repressor]}{K_{d}}})^{n}}$
For activators we are interested in how much of the DNA is bound and active:
$\frac{1}{1+(\frac{K_{d}}{[Activator]})^{n}}$
The Hill coefficient gives an idea about the strength about the interaction between the DNA and the protein and is sometimes used to estimate the amount of proteins that bind the DNA but caution is needed in using it. Indeed, the Hill function has knwown shortcomings, but it is still very useful because of its simplicity (citate paper).
The constants needed for our model are $K_d$ and $n$. :
| Protein | ${K_d (molecules)}$ | $n$ | Source |
|---|---|---|---|
| cI | 20 | 2 | 2009 iGEM Aberdeen and Wang et al. (2009) |
| LuxR/AHL | 3.7 | 1 | 2007 iGEM ETH Zurich and Basu et al. (2005) |
| PenI | 17 | 2 | Wittman et al. (1993) |
${K_d}$ is the value which corresponds with the amount of repressor or activator necessary to repress or activate half of the promoters. Since our copynumber is 200, we multiply the Hill constant with 200 because this higher value seems more logical to us.
3.4 Complexation and dimerization
Before the proteins can bind the promoter region, they first have to make complexes. cI and penI form homodimers, while luxR first forms a heterodimer with AHL and afterwards forms a homodimer with another luxR/AHL. This next part will describe the kinetics of such complexation.
3.5 Protein production kinetics
Our models comprise two product forming enzymes: LuxI and Transaminase B.
LuxI is the enzyme responsible for AHL production and Transaminase B is responsible for Leucine formation.
For LuxI kinetics Schaefer et al. (1996) found a value of 1 molecule/minute for the Vmax. Since we assume that LuxI is fully saturated with substrate, we take this value as the synthesis rate of AHL.
Transaminase B forms leucine from aKIC and glutamate. In this reaction glutamate is converted to aKG. The reaction kinetics is of the ping-pong bi bi form. This model describes a mechanism in which the binding of substrates and release of products is ordered. The enzyme shuttles between a free and a substrate-modified intermediate state.
3.6 Degradation
mRNA degradation, Protein degradation, product degradation
3.7 Diffusion
Our model has 2 types of diffusion. Diffusion from the inside of the cell to the outside and diffusion in the outside of the cell. The diffusion over the cell membrane is more complicated because some proteins play a role in it. For AHL we found a value given in molecules/second. This unit seems strange because diffusion is most often used with units in concentration. It also lead to strange results since the amount of molecules is being levelled out so the inside amount equals the outside amount even though the concentrations are different. This is why we added a correction for the volume of the cell and the external volume to it.
We assume that the volume of the cell has a shape of a cilinder and is constant. For this simplified volume we found a value of $5.65 {\cdot} 10^{-16} $ l. The outside compartment will be modelled as a cilinder in the agar with a radius that increases with $\sqrt{2*D*t}$. For the initial value of the outside compartment we take a volume slightly bigger than the cell volume.
4. Results
Cell A graph of all, graph of Leucine, graph of AHL
Cell B graph of all, graph with induction and without induction
Sensitivity analysis
Conclusion and discussion
References


Contact
Address: Celestijnenlaan 200G room 00.08 - 3001 Heverlee
Telephone n°: +32(0)16 32 73 19


