Team:UChicago/Results

Specific Experiments and Results
There were two essential goals of the assays we conducted for the oscillator plasmid (pMC001).
1. To characterize the rhamnose inducible promoter in order to manipulate the concentration of KaiA. Our hope is that altering the KaiA to KaiC ratio will help optimize the oscillations. In vitro, this KaiA : KaiC ratio was found to be ~ 1 : 3 (Nakijima, Science 2010).
2. To portray oscillations of KaiC phosphorylation. This was to be accomplished after goal 1, as an overabundance/lack of KaiA will prevent oscillations from occurring (See Figure below).
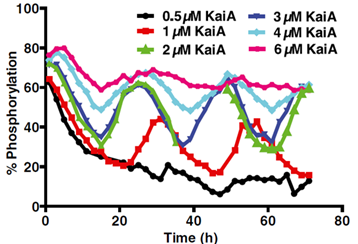
(Lin et al. PNAS, 2015)
We first attempted to characterize the L-rhamnose inducible promoter, expanding on the investigation from the Paris-Bettencourt 2012 team. The characterization of this part can be found on our “Measurements” page.
We then conducted more tests on the L-Rhamnose inducible promoter and the stability of KaiA in the context of our oscillator biobrick. In consideration of the research we conducted about the L-rhamnose promoter, we determined 16 hours to be the maximum induction time to investigate. We developed an assay in which we induced cells with 0.5% L-rhamnose and took samples of E.coli cells expressing our oscillator biobrick every 2 hours for 16 hours. These cells had been induced with 0.5% L-rhamnose, as previous characterization had confirmed that this relatively high amount of Rhamnose would lead to KaiA expression. These samples were frozen in a -80C freezer to preserve the cell conditions. Over this time course experiment, we were seeking to observe the degradation/stability of the Kai proteins. Specifically, we wanted to determine the point at which KaiA expression reached steady state. This was of utmost importance before starting oscillations, as the KaiC oscillations are dependent on steady levels of Kai proteins.
Additionally, we had to deal with the issue of synchronizing our group of oscillating cells in order to properly assay for oscillations. To do so we referenced the Silver Lab paper (Chen et al. Science 2015), in which cells were first induced in M9 minimal media with carbon supplements (0.4% glycerol, 0.1% casamino acids), then shocked in M9 minimal media with no carbon supplements for 1 hour. The oscillations in this study were tracked using M9 minimal media with leucine and succinate supplements to promote slow growth. We decided to adopt a similar protocol throughout our time course experiment and induced in the M9 supplemented medium (w/glycerol and casamino acids). We also implemented a synchronization shock for 1 hour and 6 hours after the maximum induction time of 16 hours. We conducted a 1 hour shock to remain consistent with the paper, and a 6 hour shock upon receiving recommendation from our host lab (the Rust Lab) that had experience with synchronizing cyanobacterial cells. Our final sample was taken after 62 hours of starting the experiment to simulate the time length we would assay the oscillations for.
The cell samples were analyzed using western blotting.
Results from Time Course experiment:
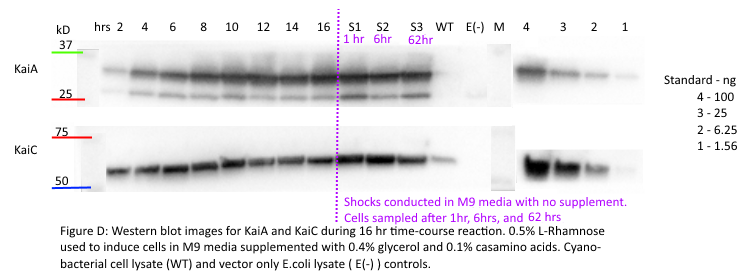
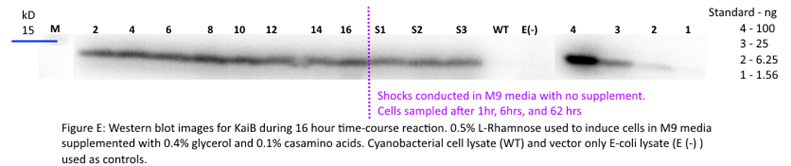
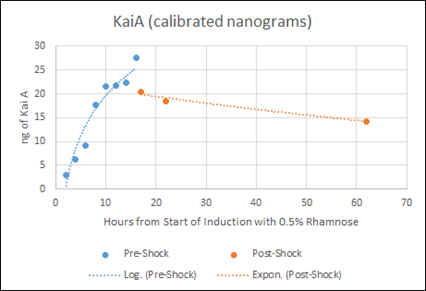
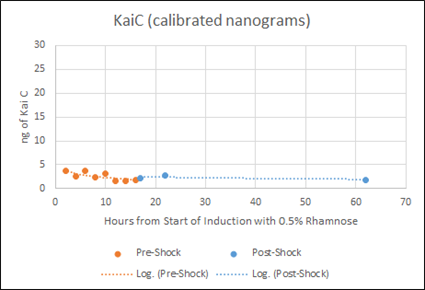

Figure F: Densitometry analysis of Kai proteins during Time Course Western Blot. Densitometry conducted in Image J. Raw protein values were fit to a standard curve developed by purified protein samples (ng of standards listed). Values also corrected for OD600 of cells. Pre-shock refers to samples before synchronization in M9 minimal media only, Post-shock refers to samples after synchronization in M9 minimal media only.
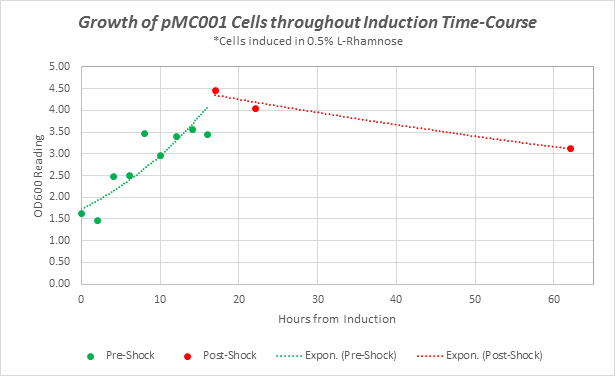
Supplementary Figure 1: Growth curves of pMC001 cells during Induction time course experiment. OD 600 readings taken at time points throughout assay.
Our results from the time course experiment show that the maximal steady state value of KaiA is reached after 16 hours. After the synchronization shock, the amount of KaiA decreases however only slightly. This decrease in KaiA was expected given the absence of rhamnose in the post-shock medium. This also indicates an inherent flaw in the set-up of our experiment -a decrease in KaiA will lead to dampened oscillations. However, the little range of decrease in KaiA indicates the potential of still being able to assay for robust oscillations. Accepting the fact that the oscillations may be dampened due to even a slight decrease in KaiA, we can still select for the most robust oscillations using different concentrations of KaiA.
Our results indicate that for KaiC, fluctuation in protein concentration is minimal compared to KaiA pre- and post-shock. This is a positive indication, as KaiC protein amounts need to remain constant for robust oscillations. The present rhamnose concentration of 0.5% however, is evidently too high as the levels (ng) of KaiC are very little compared to the levels (ng) of KaiA. This throws off the 1:3 KaiA:KaiC ratio seen in vitro. For our next experiment, we plan to obtain a better gradient characterization of the L-rhamnose promoter to obtain lower expression levels of KaiA.
Our results for KaiB indicate a decrease in KaiB protein throughout the time course pre-shock and a stable level of KaiB post-shock. This could indicate a rapid degradation rate of KaiB until KaiB reaches a low steady-state concentration. However, because we changed media between pre- and post-shock samples, we cannot determine if the stabilization was caused due to KaiB reaching steady state or because of the minimal growing conditions post shock. We speculate however that these results are caused due to issues with the western blot of KaiB itself (Figure E). Looking forward, we aim to repeat this experiment to obtain a better western blot result.
Lastly, our results provide evidence that the Kai proteins are being expressed in E.coli! (Hey, gotta start from somewhere right? J )
Note: Please check out our notebook (https://2015.igem.org/Team:UChicago/Notebook), in order to see data and evidence for constructing out beloved oscillator biobrick.
After this induction time-course experiment we performed an assay to test for oscillations. We hope to present our findings for the first oscillation test in our presentation at the 2015 iGEM competition.
What’s Next?
There were parts of our project that we were not able to get to,
if you want to learn about what we had planned, you’re in the right place!
Ø While we have the supplementary KaiC phosphomimetic plasmids constructed for the read-out systems, we have had a lot of trouble cloning and constructing pMC002 and pMC003, the main read-out constructs containing accessory read out proteins SasA, CikA and RpaA. As soon as we construct pMC002 and pMC003, we will be on our way to reconstituting a read-out system
Ø One thing that is
uncertain is whether the AANAT could be secreted with endogenous secretion
systems, and if they can, whether it could retain its enzyme activity. We chose
two pathways to test out, the Sec, or general secretion pathway, and the Tat
pathway. The Sec pathway is what wild type ecoli mainly use to export stuff,
however we weren’t sure whether it would be suitable in our situation. The main
difference between the two pathways is that the Sec pathway transports unfolded
protein through the inner membrane, which folds in the periplasm while the Tat
pathways transports folded proteins. We will use GFP as a proxy for AANAT and
overexpress the two different pathway signals. For Sec, we will use the
endogenous MalE signal while for the Tat we will use a modified TorA signal
that was created by Kyoto 2012. For the Tat pathway, we also want to test a modified
version, also by Kyoto 2012, which includes a phage shock protein to increase
transportation efficiency. We also want to test out whether we can increase the
transportation efficiency not just through the inner membrane, but through the
outer membrane as well. To test this, we will put a Kil gene on inducible
promoters in both constructs. The Kil gene increases efficiency by causing
“rips” or “holes” to appear in the outer membrane. This could cause the AANAT
to “leak out”, but also at the same time, it can kill the bacteria if
over-expressed.
And finally after testing the secretion efficiency, we will test for AANAT
activity with a colorimetric assay.
Like our team Facebook page, Genehackers@UChicago!
Questions? Comments? Send us an email!