Difference between revisions of "Team:Bielefeld-CeBiTec/Results/HeavyMetals"
| Line 97: | Line 97: | ||
<h1>Copper</h1> | <h1>Copper</h1> | ||
| − | <h2><i>in vivo</i></h2> | + | <h2><i>in vivo</i></h2></br></br> |
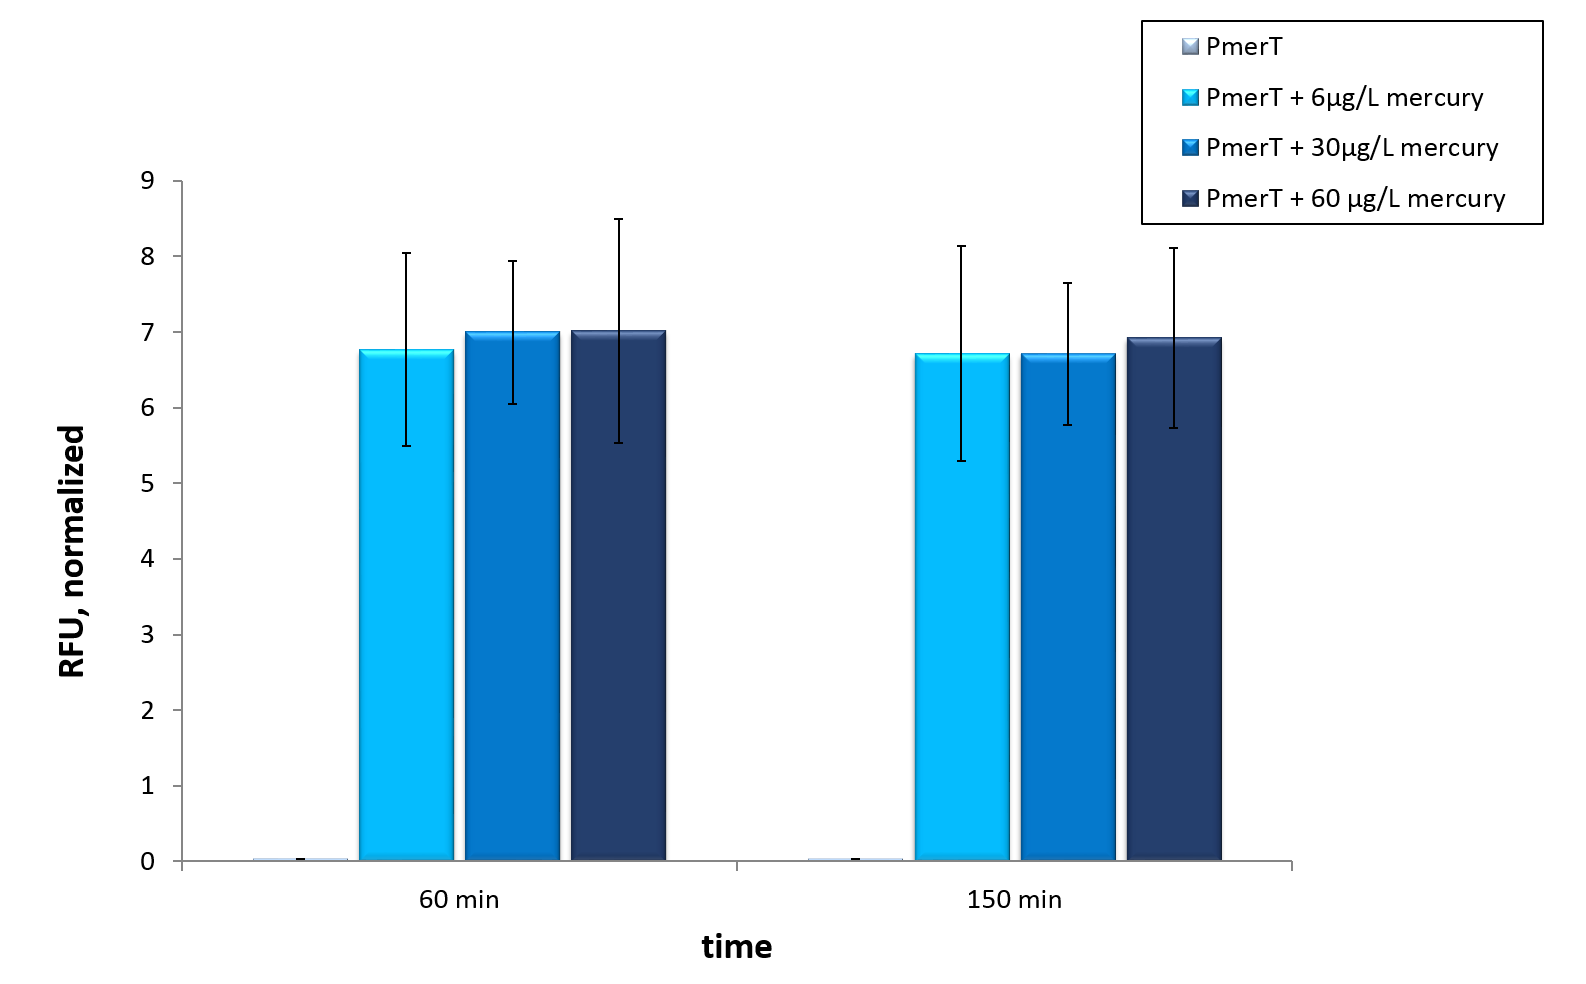
| − | + | Our sensor for copper detection consists of CueR a MerR like activator and the copper specific promoter CopAP. The promoter is regulated by the CueR, which binds Cu-ions. We also used a sfGFP behind the promoter for detection trough a fluorescence signal. </br></br> | |
<figure style="width: 600px"> | <figure style="width: 600px"> | ||
<a href="https://static.igem.org/mediawiki/2015/9/90/Bielefeld-CeBiTec_Biolector_copper.jpg" data-lightbox="heavymetals" data-title="TEXT Error bars represent the standard deviation of three biological replicates."><img src="https://static.igem.org/mediawiki/2015/9/90/Bielefeld-CeBiTec_Biolector_copper.jpg" alt="Adjusting the detection limit"></a> | <a href="https://static.igem.org/mediawiki/2015/9/90/Bielefeld-CeBiTec_Biolector_copper.jpg" data-lightbox="heavymetals" data-title="TEXT Error bars represent the standard deviation of three biological replicates."><img src="https://static.igem.org/mediawiki/2015/9/90/Bielefeld-CeBiTec_Biolector_copper.jpg" alt="Adjusting the detection limit"></a> | ||
<figcaption>TEXT. Error bars represent the standard deviation of three biological replicates.</figcaption> | <figcaption>TEXT. Error bars represent the standard deviation of three biological replicates.</figcaption> | ||
| − | </figure> | + | </figure></br></br> |
| − | + | <i>In vivo</i> we could show that the adding different concentrations of chromium has different effects on the transcription of sfGFP. </br></br> | |
<figure style="width: 600px"> | <figure style="width: 600px"> | ||
<a href="http://https://static.igem.org/mediawiki/2015/4/4e/Bielefeld-CeBiTec_Biolector_copper_Balkendiagramm.jpeg" data-lightbox="heavymetals" data-title="TEXT Error bars represent the standard deviation of three biological replicates."><img src="https://static.igem.org/mediawiki/2015/4/4e/Bielefeld-CeBiTec_Biolector_copper_Balkendiagramm.jpeg" alt="Adjusting the detection limit"></a> | <a href="http://https://static.igem.org/mediawiki/2015/4/4e/Bielefeld-CeBiTec_Biolector_copper_Balkendiagramm.jpeg" data-lightbox="heavymetals" data-title="TEXT Error bars represent the standard deviation of three biological replicates."><img src="https://static.igem.org/mediawiki/2015/4/4e/Bielefeld-CeBiTec_Biolector_copper_Balkendiagramm.jpeg" alt="Adjusting the detection limit"></a> | ||
Revision as of 04:33, 14 September 2015
Heavy Metals
Zusammenfassung in ganz wenigen Worten.

Arsenic
in vivo

in vitro
Chromium
in vivo
Our sensor for chromium detection consists of ChrB the repressor and the chromate specific promoter ChrP. The promoter is regulated by the ChrB, which binds Cr-ions. Behind the promoter is a sfGFP for detection of a fluorescence signal. In vivo we could show that the addition of different concentrations of chromium have different effects to transcription of sfGFP.

in vitro


Copper
in vivo
Our sensor for copper detection consists of CueR a MerR like activator and the copper specific promoter CopAP. The promoter is regulated by the CueR, which binds Cu-ions. We also used a sfGFP behind the promoter for detection trough a fluorescence signal.

in vitro


Lead
in vivo


Mercury
in vivo


in vitro


Nickel
in vivo

