Difference between revisions of "Team:UESTC Software/Results"
| Line 79: | Line 79: | ||
<p>We selected 29 organisms, which are all organisms in our database, as reference species. As a result, 196 genes are filtered to form a minimal gene set. We made a chart as follow figure to show the distribution of the COG functional categories of minimal gene set.</p> | <p>We selected 29 organisms, which are all organisms in our database, as reference species. As a result, 196 genes are filtered to form a minimal gene set. We made a chart as follow figure to show the distribution of the COG functional categories of minimal gene set.</p> | ||
<p>The chart indicates that most genes in minimal gene set are responsible for translation, ribosomal structure and biogenes (R), and the next is transport and metabolism (H, G, F, E). Among them, the ratio of category which is named translation, ribosomal structure and biogenes (R) reached 45.4%. Of course, There are also 11 categories have no genes. That means these functions are not important to the survival of the organisms.</p> | <p>The chart indicates that most genes in minimal gene set are responsible for translation, ribosomal structure and biogenes (R), and the next is transport and metabolism (H, G, F, E). Among them, the ratio of category which is named translation, ribosomal structure and biogenes (R) reached 45.4%. Of course, There are also 11 categories have no genes. That means these functions are not important to the survival of the organisms.</p> | ||
| − | <img src="/wiki/images/6/60/Team-UESTC_Software_results1.jpg"> | + | <div> |
| + | <img src="/wiki/images/6/60/Team-UESTC_Software_results1.jpg"> | ||
| + | <p>the distribution of the COG functional categories of minimal gene set filtered by 29 species</p> | ||
| + | </div> | ||
<h2>Proving the stability</h2> | <h2>Proving the stability</h2> | ||
<p>In order to further verify stability and regularity of this result, we also calculate the distribution of COG functional categories of the minimal gene set which filtered by 16 reference species. 16 species are all organisms in previous version of database. Result is showed in follow figure. The distribution of the two groups of results are roughly the same. </p> | <p>In order to further verify stability and regularity of this result, we also calculate the distribution of COG functional categories of the minimal gene set which filtered by 16 reference species. 16 species are all organisms in previous version of database. Result is showed in follow figure. The distribution of the two groups of results are roughly the same. </p> | ||
| − | <img src="/wiki/images/6/6c/Team-UESTC_Software_results2.jpg"> | + | <div> |
| + | <img src="/wiki/images/6/6c/Team-UESTC_Software_results2.jpg"> | ||
| + | <p>the distribution of the COG functional categories of minimal gene set filtered by 16 species</p> | ||
| + | </div> | ||
</div> | </div> | ||
</div> | </div> | ||
Revision as of 13:53, 17 September 2015
Results
Analysis of result
We selected 29 organisms, which are all organisms in our database, as reference species. As a result, 196 genes are filtered to form a minimal gene set. We made a chart as follow figure to show the distribution of the COG functional categories of minimal gene set.
The chart indicates that most genes in minimal gene set are responsible for translation, ribosomal structure and biogenes (R), and the next is transport and metabolism (H, G, F, E). Among them, the ratio of category which is named translation, ribosomal structure and biogenes (R) reached 45.4%. Of course, There are also 11 categories have no genes. That means these functions are not important to the survival of the organisms.
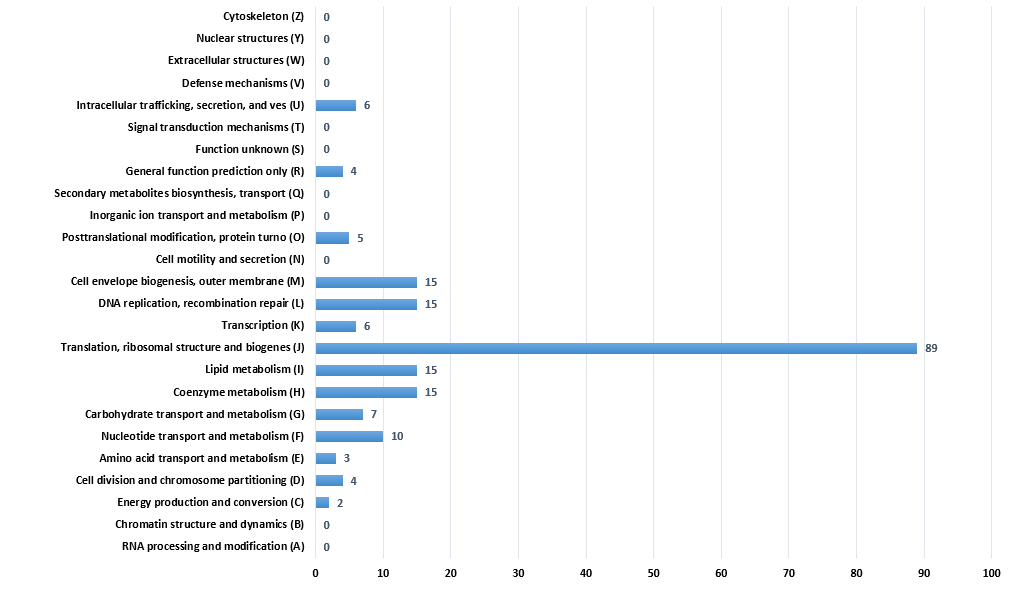
the distribution of the COG functional categories of minimal gene set filtered by 29 species
Proving the stability
In order to further verify stability and regularity of this result, we also calculate the distribution of COG functional categories of the minimal gene set which filtered by 16 reference species. 16 species are all organisms in previous version of database. Result is showed in follow figure. The distribution of the two groups of results are roughly the same.
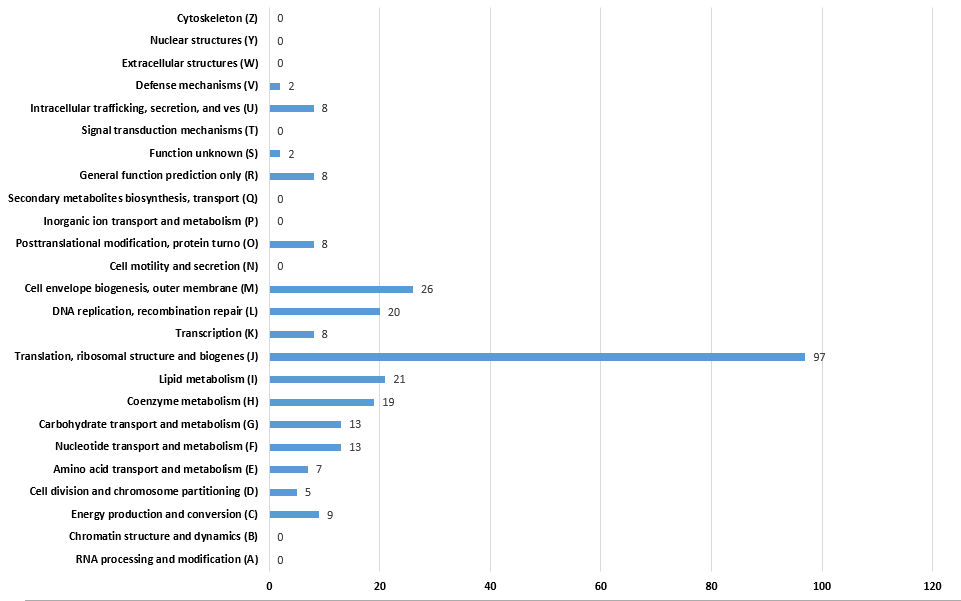
the distribution of the COG functional categories of minimal gene set filtered by 16 species