The different sensors we worked with were characterized in vivo as well as in vitro.
We tested the influence of each heavy metal on our sensors in vivo Therefore we used heavy metal concentrations based on heavy metal occurrences measured all over the world.
Influence of heavy metals on the growth of E.coli KRX shown is the standard deviation of three biological replicates. For induction concentrations of
20 µg/L lead, 60 µg/L mercury, 60 µg/L chromium, 80 µg/L nickel, 40 mg/L copper which represent ten times of the WHO guideline were used.
The tested heavy metal concentrations had no negative effect on E. colis growth. Moreover there is no significant difference between the curves with heavy metals and the controls. This first experiment showed us, in vivo characterization with these sensors under the tested heavy metal concentrations is possible. Most of our sensors were cultivated in the BioLector. Due to the accuracy of this device we could measure our sample in duplicates.
Arsenic
in vivo
We tested an arsenic sensor with mRFP1 as reporter gene in vivo to confirm that the sensor is functional and test whether it is possible to detect the safety limit as defined by the WHO. We observed a reaction approximately five hours after addition of arsenic. The safety limit of 10 µg/L could clearly be distinguished from the negative control and the fluorescence signal increased up to a concentration of 500 µg/L. The signal in the presence of 1000 µg/L was slightly lower than in the presence of 500 µg/L.
Time course of the induction of an arsenic biosensor with RFP for different arsenic concentrations in vivo. Error bars represent the standard deviation of three biological replicates.
in vitro
In order to test the arsenic sensor in our cell-free protein synthesis, we cloned a device that contains the arsenic operator between the T7 promoter and sfGFP with our optimized untranslated region (UTR). We tested this device in a cell extract that had been generated from cells expressing the arsenic repressor. We observed an induction when adding arsenic up to a concentration of 1.87 mg/L. As high arsenic concentrations inhibit the performance of the CFPS, we normalized the results for this effect. In the final application, this task is performed by our app.
Induction of arsenic sensor in vitro. For this experiment, a cell extract which already containes the arsenic repressor was used. Error bars represent the standard deviation of three biological replicates.
Chromium
in vivo
Our sensor for chromium detection consists of ChrB the repressor and the chromate specific promoter ChrP. The promoter is regulated by the ChrB, which binds Cr-ions. Behind the promoter is a sfGFP for detection of a fluorescence signal.
In vivo we could show that the addition of different concentrations of chromium have different effects to transcription of sfGFP.
Time course of the induction of a chromium biosensor with sfGFP for different chromium concentrations in vivo. The data are measured with BioLector and normalized on OD600. Error bars represent the standard deviation of two biological replicates.Fluorescence levels at three different stages of cultivation. Shown are levels after 60 minutes, 150 minutes and 650 minutes. Error bars represent the standard deviation of three biological replicates.
Our data lead to the conclusion that in a cell based system it is possible to detect chromium.
In contrast to our expectations with higher chromium concentrations we got lower fluorescence levels. These observations needed further investigation.
in vitro
Influence of different copper concentrations on our crude cell extract. Error bars represent the standard deviation of three biological replicates.
As shown above copper has no negatice influence on the functuality of our cell extact. Therefore a ralatively stable system for copper sensing is provided.
First Tests with specific cell extract and different copperconcentrations lead tu further tests and normilisations
Copper specific cell extract made from E. coli cells which have already expressed the activator before cell extract production. Induction of copper inducible promoter without T7 in front of the operator site with different copper concentrations. Error bars represent the standard deviation of three biological replicates.
Copper specific cell extract made from E. coli cells which have already expressed the activator before cell extract production. Induction of copper inducible promoter without T7 in front of the operator site with different copper concentrations. Error bars represent the standard deviation of three biological replicates. Data are normalized on coppers influence to the cell extract.Copper specific cell extract made from E. coli cells which have already expressed the activator before cell extract production. Induction with different copper concentrations. Error bars represent the standard deviation of three biological replicates.TEXT. Error bars represent the standard deviation of three biological replicates.
Lead
in vivo
TEXT. Error bars represent the standard deviation of three biological replicates.TEXT. Error bars represent the standard deviation of three biological replicates.
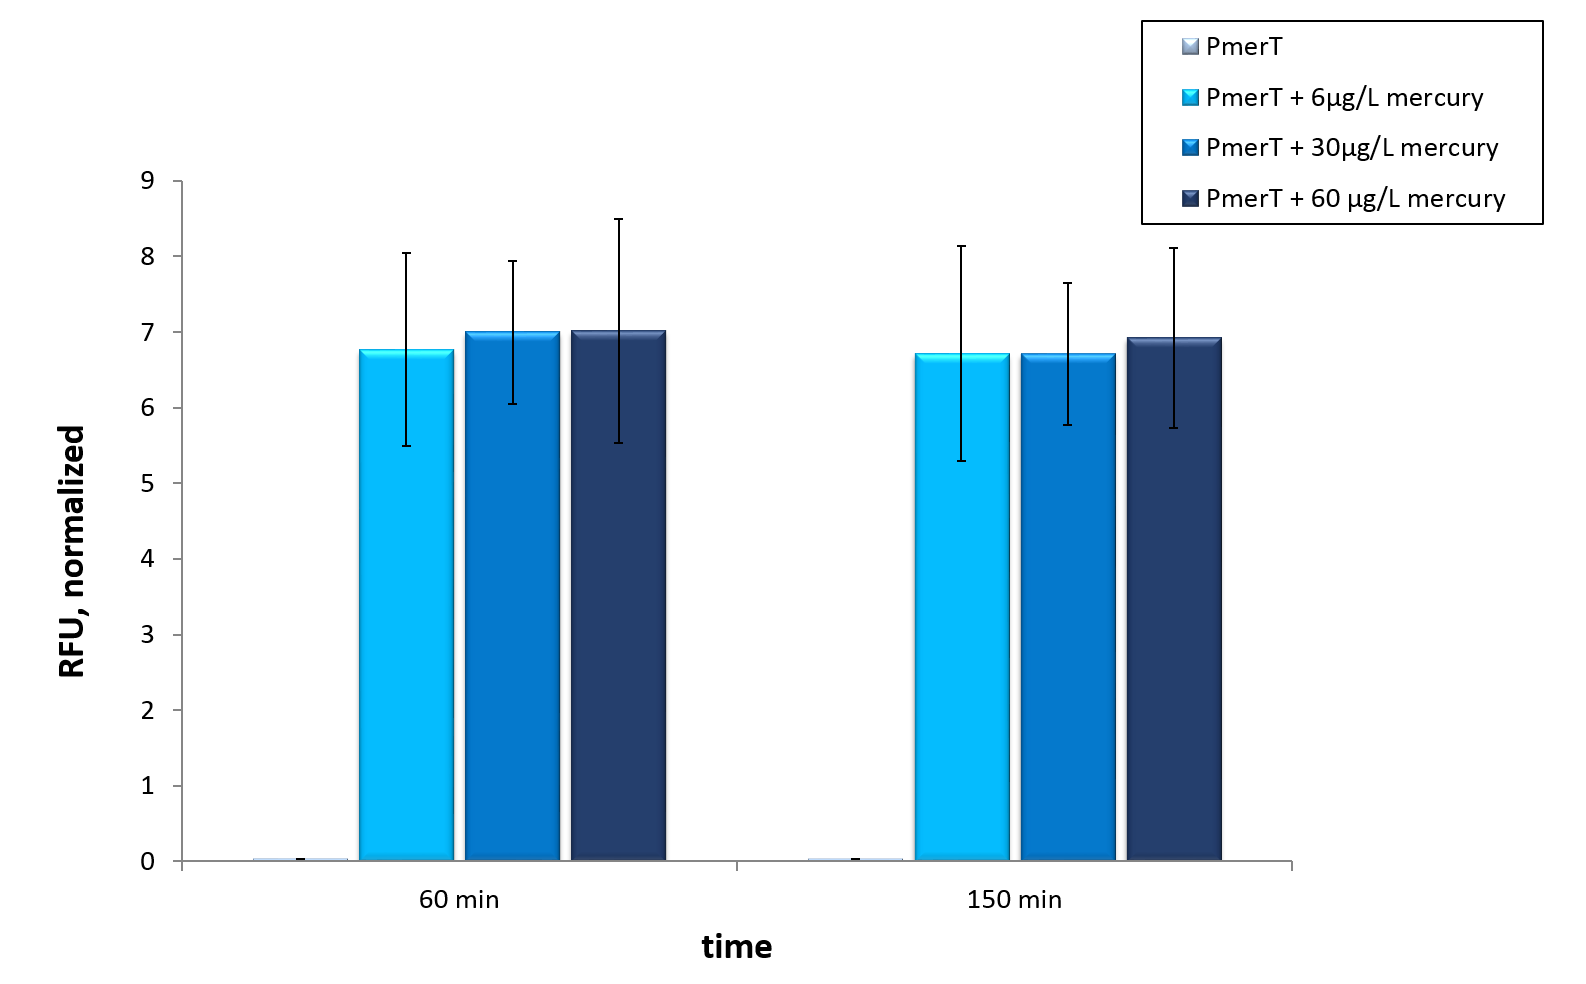
Mercury
in vivo
TEXT. Error bars represent the standard deviation of three biological replicates.TEXT. Error bars represent the standard deviation of three biological replicates.
in vitro
TEXT. Error bars represent the standard deviation of three biological replicates.TEXT. Error bars represent the standard deviation of three biological replicates.TEXT. Error bars represent the standard deviation of three biological replicates.TEXT. Error bars represent the standard deviation of three biological replicates.
Nickel
in vivo
TEXT. Error bars represent the standard deviation of three biological replicates.TEXT. Error bars represent the standard deviation of three biological replicates.