Difference between revisions of "Team:TU Delft/Description"
| Line 155: | Line 155: | ||
<h3>Methodology</h3> | <h3>Methodology</h3> | ||
<p class="lead">At first we measured an OD600 of 3.00 of an overnight culture of ∆csgA_csgA_pSB1C3 cells. We diluted the sample down to an OD600 of approximately 0.05, with LB medium + CAM (antibiotic, chloramphenicol). To achieve an end volume of 4 mL we took 67 µl of the overnight culture and 3933 µl of LB + CAM. We let the cells in the new sample grow for 1.5 hour at 37°C to reach the exponential phase (OD between 0.35-0.60). After the cells reached the exponential phase, we induced 1 mL of the culture with 1% rhamnose (250 µl from our 5% rhamnose stock) and also took 1 mL sample of the uninduced culture. We incubated both samples overnight at room temperature to allow the production of nanowires. Finally, the samples were directly added to the grid and the following TEM pictures were taken.</p> | <p class="lead">At first we measured an OD600 of 3.00 of an overnight culture of ∆csgA_csgA_pSB1C3 cells. We diluted the sample down to an OD600 of approximately 0.05, with LB medium + CAM (antibiotic, chloramphenicol). To achieve an end volume of 4 mL we took 67 µl of the overnight culture and 3933 µl of LB + CAM. We let the cells in the new sample grow for 1.5 hour at 37°C to reach the exponential phase (OD between 0.35-0.60). After the cells reached the exponential phase, we induced 1 mL of the culture with 1% rhamnose (250 µl from our 5% rhamnose stock) and also took 1 mL sample of the uninduced culture. We incubated both samples overnight at room temperature to allow the production of nanowires. Finally, the samples were directly added to the grid and the following TEM pictures were taken.</p> | ||
| − | <h3>Results<h3> | + | <h3>Results</h3> |
<figure><img class="featurette-image img-responsive center-block" src="https://static.igem.org/mediawiki/2015/4/42/TU_Delft_2015_WithWithoutCUrli.png" style="width:100%; background-size: cover;" alt="Generic placeholder image"><figcaption>Figure 8: Pictures taken with TEM (magnification 7300 x). The left picture shows the situation without induction (0% rhamnose) and the right one shows the situation with induction (1% rhamnose).</figcaption></figure> | <figure><img class="featurette-image img-responsive center-block" src="https://static.igem.org/mediawiki/2015/4/42/TU_Delft_2015_WithWithoutCUrli.png" style="width:100%; background-size: cover;" alt="Generic placeholder image"><figcaption>Figure 8: Pictures taken with TEM (magnification 7300 x). The left picture shows the situation without induction (0% rhamnose) and the right one shows the situation with induction (1% rhamnose).</figcaption></figure> | ||
| Line 178: | Line 178: | ||
<figure><img class="featurette-image img-responsive center-block" src="https://static.igem.org/mediawiki/2015/4/44/TU_Delft_2015_projTable1.png" style="width:100%; background-size: cover;" alt="Generic placeholder image"><figcaption>Table 2. Strains of Escherichia coli used for assess the biofilm formation using crystal violet</figcaption></figure> | <figure><img class="featurette-image img-responsive center-block" src="https://static.igem.org/mediawiki/2015/4/44/TU_Delft_2015_projTable1.png" style="width:100%; background-size: cover;" alt="Generic placeholder image"><figcaption>Table 2. Strains of Escherichia coli used for assess the biofilm formation using crystal violet</figcaption></figure> | ||
<p class="lead">The cultures of both strains were grown and induced in a 96-well plate. 40 hours after the induction, the samples were washed with water (in order to disregard non-attached, planktonic cells) and dyed with crystal violet (figure 9.). </p> | <p class="lead">The cultures of both strains were grown and induced in a 96-well plate. 40 hours after the induction, the samples were washed with water (in order to disregard non-attached, planktonic cells) and dyed with crystal violet (figure 9.). </p> | ||
| − | <figure><img class="featurette-image img-responsive center-block" src="https://static.igem.org/mediawiki/2015/a/a7/TU_Delft_2015_fff9def.png" style="width: | + | <figure><img class="featurette-image img-responsive center-block" src="https://static.igem.org/mediawiki/2015/a/a7/TU_Delft_2015_fff9def.png" style="width:70%; background-size: cover;" alt="Generic placeholder image"><figcaption>Figure 9. 96-well plate used for test the biofilm-making capability of our designed constructs. The first two rows (A-B) contained cultures with 0% w/v of rhamnose. The columns D-E and G-H were inducted with l-rhamnose to a final concentration of 0.2%w/v and 0.5%w/v respectively. The green boxes show the strains carrying BBa_K1583000, and the red ones the control strain with pSB1C3.</figcaption></figure> |
<h3>Results and discussion</h3> | <h3>Results and discussion</h3> | ||
<p class="lead">In the end, the wells were diluted with ethanol so all the content can dissolve in the liquid phase. We measured the absorbance at 590 nm of wavelength for all the samples, obtaining the following results (figure 10.):</p> | <p class="lead">In the end, the wells were diluted with ethanol so all the content can dissolve in the liquid phase. We measured the absorbance at 590 nm of wavelength for all the samples, obtaining the following results (figure 10.):</p> | ||
Revision as of 15:56, 18 September 2015


Project Biolink
3D printing of bacterial biofilms, linked together through nanowires
Project Description
In this section we describe the Problem and Solution, our Biolink project as well as an overview of the synthetic biology and printing process in the project.
Problem and Solution
Biofilms are communities of bacteria connected by protein nanowires and surrounded by an extracellular matrix. In this form, they are more resistant and can severely affect human health, industrial productivity and the environment. More precisely, biofilms can cause infections in the human body, affect water quality, and damage industrial installations and equipment. Research and industry have been working to find various solutions for preventing and removing this threat. Potential solutions, such as health products, drugs and industrial removal products, are tested on artificially formed biofilms.

The problem with biofilms formed artificially is that they are time consuming, difficult to control and to reproduce. This means that artificial biofilms do not reflect natural biofilm characteristics, making product testing unreliable. Therefore, biofilm-removal products may have a different effect when used in natural settings, with unforeseen negative side-effects and reduced efficiency.

Our project is entitled Biolink and provides an alternative to current biofilm formation technologies. We use a 3D printer, which we call The Biolinker, to form layers of a designed bioink made of bacteria that can bind together into a desired structure.
Biolink helps biofilm-related industries in several ways. First, it brings reproducibility and control to how bacterial biofilms can be artificially formed. Second, biofilm printing adds automation and scalability, making biofilm formation processes more efficient, and thus, cheaper. Hence, Biolink can help to design safer and more effective anti-biofilm solutions by increasing biofilm testing process efficiency and resemblance to reality.
The Biolink Project
Our printing system, called Biolink, can be summarized in the following sentence: biofilm producing bacteria are printed with the help of a flexible scaffold hydrogel. First of all, our homemade bacteria (modified to make biofilms) are mixed with a solution of sodium alginate and subsequently with calcium chloride. There, the Ca2+ molecules keep the structure fixed creating a stable gel. This hydrogel-bacteria mixture is then induced with rhamnose, a sugar specific for our promoter, which makes them synthesize CsgA, the linking molecule. CsgA proteins polymerize to an amyloid structure surrounding the cells and connecting them to each other through the scaffold. Once the cells are all attached in the structure defined by the gel scaffold, it is no longer necessary. Consequently, the hydrogel is dissolved with sodium citrate. But the cells are still connected due to the curli amyloid! So, we obtain a perfectly defined 3D structure made of bacteria.
(SLIDESHOW HERE)The Biolink project promotes the open source and educational spirit of iGEM. Our 3D printer, the Biolinker, is made of K’NEX construction toys, a DIY solution that is both easy to build and efficient in doing its job. Through policy and practice we try to position our project within the synthetic biology industry and academia, as well as observe socio-economic perception and feedback. We accomplish this by analyzing and interviewing stakeholders, treating ethical and regulatory issues, and building a business plan around our project.
Synthetic Biology in our Project
During biofilm formation, bacteria produce an extracellular matrix made of amyloid structures. These amyloid structures are curli fimbriae, composed of intertwined filaments with a thickness of approximately 4-7 nm (Nguyen, 2014). Therefore, curli production helps bacteria bind to each other in natural biofilms (Taylor et. al. 2012). There are two distinctive operons involved in this highly regulated pathway; csgBA and csgDEFG. The csgBA operon encodes for two proteins: CsgA and CsgB. The csgDEFG operon encodes for the proteins required for the transport of CsgA and CsgB to the cell surface (Dueholm et al, 2011).
On one hand, CsgA is an amyloid protein that acts as monomer for curli formation. On the other hand, the protein CsgB in an integral membrane protein, which binds CsgA to the cell; CsgB acts as an anchor for curli formation. CsgA is transported as an unfolded protein to the extracellular matrix. Once outside the cell, it aggregates with CsgB and the self-assembly of these aggregates form the amyloid fibrils. When CsgA comes in contact with CsgB, the fibrils bind to another cell and the process is repeated again until an entire network has been created (Barnhart et al, 2006).
In our project, we designed an inducible system for synthesizing CsgA in biofilm-making deficient cells. Besides to that, we aimed to create a customized biofilm. To do so, we designed different biobricks that contain a peptide tail attached to the sequence of the biofilm protein CsgA that provides a specific surface affinity. In the end, we planned to use our engineered cells (which also express a fluorescent reporter) for printing in different layers; printing biofilms in 3 dimensions.
The Bioink and Alginate as Supporting Scaffold
In initial experiments printing with bacterial cells dispersed in LB media it quickly became obvious, that a supporting scaffold would be required: due to surface interactions the liquid spread out creating a final thickness of the printed line of almost one centimeter. In tissue engineering sodium alginate is commonly used as a synthetic extracellular matrix material (Rowley et al., 1999). Inspired by this, we took a look at sodium alginate to use as a scaffold material. Sodium alginate is a carbohydrate polymer which can be fairly well dissolved in water, but in contact with calcium ions (or other divalent cations) the polymers are connected via electrostatic interactions forming a hydrogel. Made for instance from LB, this hydrogel could provide bacterial cells with everything they need for weeks and keep them alive. Furthermore, jellification is a reversible process by complexing the calcium ions with citrate and replacing it again with sodium ions (Rowley et al., 1999). Thus, we had found a substance ideally meeting our purpose of being initially liquid, capable of rapidly turning into a viscous gel and reversing this process again.
Strains
The strains used for our project are described here
Escherichia coli K-12 MG1655 PRO ΔcsgA ompR234
This strain of Escherichia coli, used in previous studies of amyloid fiber production in bacteria, is characteristic for having knocked-out the CsgA gene. However, it has all the other genes required for formation of the curli structure.
We have used this strain for our project as the main organism for the printing process. As the bacteria cannot express csgA, we transformed our strains with a plasmid containing this gene under the control of an inducible promoter. Consequently, we can modulate where and when the amyloid fiber will be formed! (Chen, A.Y., et al. 2014)

Escherichia coli Top10
This strain was used exclusively for highly efficient transformations. We used this organism for cloning experiments, plasmid isolations and other basic steps of our project.

Linking Cells
The possibility of printing bacteria in structured layers is supported by the biological property of making biofilms. In this part of the project we studied the proteins that allow cells to produce connections, and how we can modulate their production
Introduction and Motivation
Printing a biofilm requires the bacteria to produce several components that allow them to make a connection between them. Furthermore, they require to attach to the surface where they are printed on. Finally, they need to make the biofilm only when it is desired.
In order to study the connections that exist between bacteria, we focused on the bacterial amyloid curli structure. These bacterial structures contribute to biofilm performances where cells interact with other cells and even surfaces. The curli consists of proteins bound together and to the cell membrane. CsgA, the main subunit, polymerizes in the extracellular space creating an amyloid nanowire; and CsgB anchors this nanowire to the membrane, creating connections between different cells (Joshi et al., 2014).
Consequently, we designed different versions of biobricks (see Parts) coding for the CsgA gene to create a biofilm in a controlled manner from CsgA deficient cells. To prevent premature biofilm formation and clogging of our printer, we designed the expression of CsgA to be inducible by rhamnose so that the biofilm is only created after the cells are printed. This also functions as a safety feature in case of escape. The experiments (and their results) that we used to analyse the expression of CsgA and its promoter are explained in this section.
Background
In the kinetic experiment, the fluorescence signal of the proteins CsgA and CsgA-GFPmut3 (I13504) proteins expressed by our constructs was recorded in time. Besides fluorescence, we measured the OD600 of our cultures in order to normalize the fluorescence signal per cell. The main goal of this experiment was to see, if different induction levels with increasing rhamnose concentrations would lead to a higher production of CsgA. If this was true, the quantity of produced CsgA present in the medium could be controlled. This degree of control is key to achieving our main goal; making a biofilm with reproducible strength.
The obtained results can be used to calculate the promoter strength at different induction levels of rhamnose in our model. In order to use the mathematical model previously constructed in the modeling section, it has to be fitted to GFPmut3 units/cell/second. Therefore, we set up a calibration curve with exactly the same settings as the fluorescent experiment in order to correlate fluorescence signal to units of GFPmut3 per cell.
Methodology
In this experiment, the strains ∆csgA – csgA- I13504 and ∆csgA – csgA strain were both induced with rhamnose at different concentrations. The different induction levels can be found in Table 1.

All conditions (ID 1 – 6) were carried out in triplicates for accurate statistical analysis of the data. The different cultures were grown and induced in a 96-well plate. The OD600 and the fluorescence signal was recorded with a plate reader during an 18-hour period at 30°C.
Results and discussion
In Figure 5, the fluorescent signal was normalized with the number of cells and plotted as a function of time. The red bars denote the error within each ID.
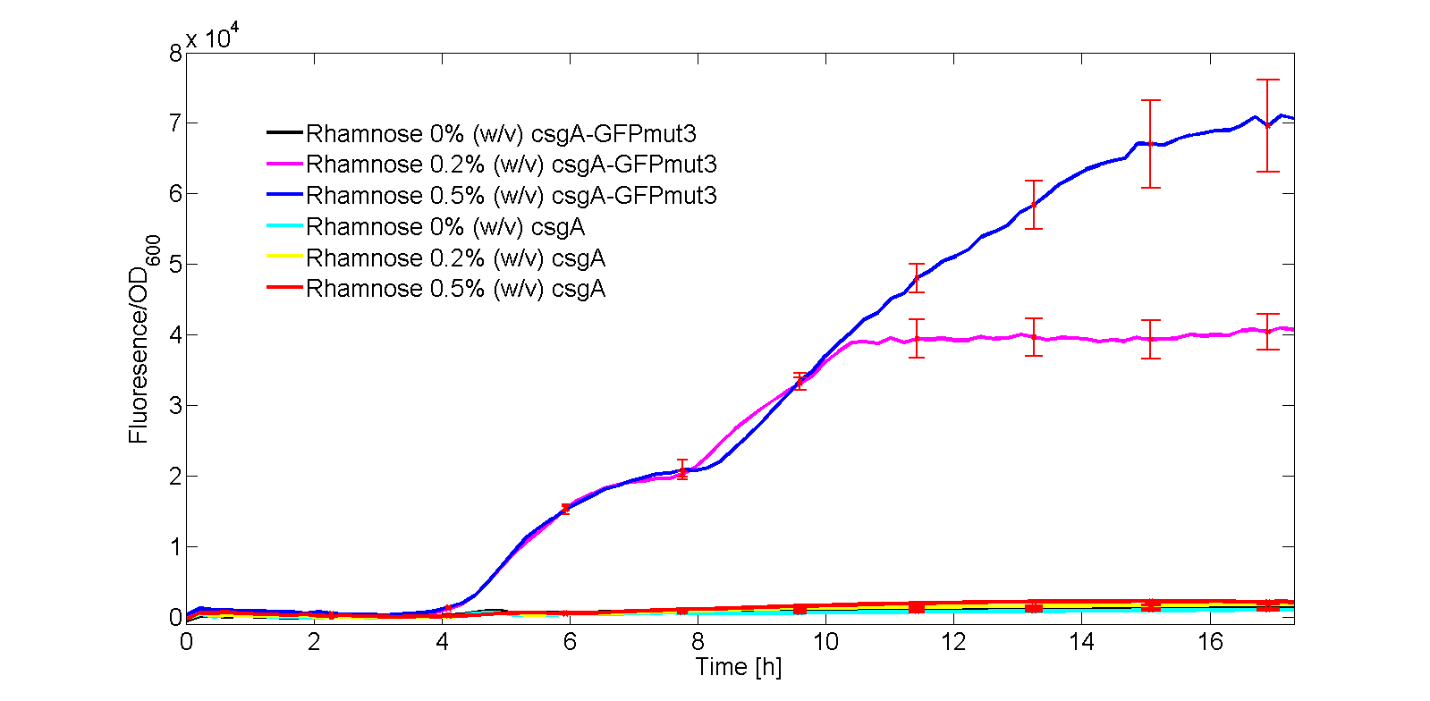
As observed in Figure 5, only the strains carrying the csgA-GFPmut3 construct induced with 0.2% (w/v) and 0.5% (w/v) showed a clear increase in fluorescence signal over time. The rest of the cultures, didn’t show significant fluorescence over time.
Furthermore, we have showed that increasing concentrations of rhamnose lead to increasing amounts of produced csgA-GFPmut3 and thus fluorescence. Finally, as the fluorescence signal is normalized by the cell density, one can make statements about the activity of the rhamnose promoter. The promoter seems to not be active directly after induction, but activity is observed after a time period of 3 to 4 hours. This is in accordance with data from literature (Wegerer et. Al, 2008), in which low fluorescence levels were observed after 2 hours of induction of the rhamnose promoter.
The calibration line of fluorescence versus mass amount GFPmut3 is given in Figure 6.

The corresponding function of the GFPmut3 calibration line is:

With massGFP in ng.
In the modelling, the fluorescent data in Figure 5 will be further converted to molecules GFPmut3/cell and the promoter activity will be calculated for both the 0.2% (w/v) and 0.5% (w/v) level of rhamnose induction. With this kinetic experiment, we have proven that our csgA-GFPmut3 construct is able to produce different levels of GFPmut3 by varying the rhamnose concentration.
Background
With our biofilm formation model we aimed to estimate how many times the nanowires overlap in order to predict the biofilm strength. One of the variables required for this model is the persistence length. In order to determine it, we have to visualize the nanowires produced by our engineered bacteria. Moreover we wanted to visualize the difference between induced and uninduced cultures containing the csgA_pSB1C3 plasmid with a rhamnose inducible promoter. These experiments required using an electron microscope.
Electron microscopes use electrons to visualize nano-objects, such as the curli nanowires. In the large “gun” the electrons get enough space to accelerate before they illuminate the sample. As shown in Figure 7 after the electrons are fired by the gun, an electric field of several thousand volts is applied to the electron beam in order to point this to the sample. In the case of an TEM, the electrons pass through the sample where the detector can detect the sample (Boysen & Muir, 2011).

Methodology
At first we measured an OD600 of 3.00 of an overnight culture of ∆csgA_csgA_pSB1C3 cells. We diluted the sample down to an OD600 of approximately 0.05, with LB medium + CAM (antibiotic, chloramphenicol). To achieve an end volume of 4 mL we took 67 µl of the overnight culture and 3933 µl of LB + CAM. We let the cells in the new sample grow for 1.5 hour at 37°C to reach the exponential phase (OD between 0.35-0.60). After the cells reached the exponential phase, we induced 1 mL of the culture with 1% rhamnose (250 µl from our 5% rhamnose stock) and also took 1 mL sample of the uninduced culture. We incubated both samples overnight at room temperature to allow the production of nanowires. Finally, the samples were directly added to the grid and the following TEM pictures were taken.
Results

In Figure 8, both the situation, pictured with TEM, without induction (the left one) and with induction (the right one) are shown with a magnification of 7300 x. The situation in which there was no induction with rhamnose, the bacteria did not show any curli formation. The opposite was true for the case in which the cells were induced with rhamnose. As the TEM picture clearly shows, nanowires are present after induction.
Background
The bacteria that we engineered for the project are capable of producing curli proteins after induction with L-rhamnose. However, the goal of our project is the printing of biofilms and not the sole overexpression of these proteins. In order to assess whether our CsgA-producing bacteria can make a biofilm or just remains planktonic, our team adapted the protocol from Zhou et al. (2013) that employs crystal violet (methyl violet 10B) for dying the biofilm-making bacteria that attach to surfaces.
According to the source article (Zhou et al., 2013), a deficient mutant of Escherichia coli is unable to produce a biofilm. By performing this experiment, we want to go further in characterizing our curli proteins; we want to answer this question: are we really making biofilms?
Methodology
In the experiment, our CsgA-producing strain of E.coli is induced at a high (0.5% w/v), low (0.2% w/v) and no (0% w/v) concentration of L-rhamnose. Furthermore, csgA deficient bacteria transformed with an empty plasmid (pSB1C3) are also tested and used as a control (Table 2.). All the experiments were carried out in triplicates.

The cultures of both strains were grown and induced in a 96-well plate. 40 hours after the induction, the samples were washed with water (in order to disregard non-attached, planktonic cells) and dyed with crystal violet (figure 9.).

Results and discussion
In the end, the wells were diluted with ethanol so all the content can dissolve in the liquid phase. We measured the absorbance at 590 nm of wavelength for all the samples, obtaining the following results (figure 10.):

The cells induced with l-rhamnose showed an increased absorbance at 590 (the peak of the dye) when compared to the empty-plasmid controls, and also with the non-induced sample. That results clearly demonstrate how our engineered cells with BBa_K1583000 successfully make biofilms, regarding that the empty plasmid controls and the analysed samples have significantly (table 3.) higher crystal violet retention. On the other hand, a higher concentration of rhamnose is not leading to a higher expression. The cells induced with a 0.2% w/v of rhamnose seem to create better a biofilm structure. However, this could be a consequence of different growth patterns; the cultures induced with 0.5% w/v of rhamnose could have stopped duplicating earlier, so the cell concentration could have decreased. So, the dyed area could be consequently smaller.

Conclusions and Future Directions
Affinity Tags
Subtitle
Introduction and Motivation
Conclusions and Future Directions
Printing Biofilm Layers Using Fluorescent Cells
Subtitle
References