Team:ETH Zurich/Results
- Project
- Modeling
- Lab
- Human
Practices - Parts
- About Us

Results
We are excited to present a lot of interesting results, including the characterization of parts of the natural E. coli LldPRD operon on which there is only a very limited amount of information present in the literature up to date, as well as a library of promoters, in which we present a better alternative to the wild-type promoter. We also increased the sensitivity of the system by the addition of LldP. In addition, we developed a hybrid promoter responsive to LacI and LldR which shows an AND gate behaviour.
We also characterized the behaviour of our system with aiiA; and explored the possibility of Annexin V expression on the outer membrane. Last but not least, we validated our lactate sensor in a nanoliter plate.
For a better understanding of the results of our project, we divided this part into three parts:
Goals
Our main aims during this project were:
- A highly sensitive lactate sensor
- the characterization of the natural lldR-promoter (K822000)
- the characterization of our 8 newly designed syntehtic promoters controlled by the regulator LldR
- the characterization of 2 newly designed hybrid promoters, combining repression by LldR and LacI
- the characterization of the impact of the L-lactate permease LldP on the sensitivity of our system.
- the detection of CTC based on their elevated lactate output
- Quorum sensing with low levels of leakiness
- the characterization of the influence of AHL degradation by AiiA on the sensitivity of the LuxR quorum sensing system
- the design and validation of a tight
- Apoptosis detection by E. coli binding to mammalian cells
- the induction of apoptosis in cancer cells using sTRAIL
- establishment of a system for display of Annexin V on the E. coli outer membrane
- the investigation of binding of bacteria to apoptotic mammalian cells via Annexin V and phosphatidylserine
Bacterial sensor
We performed a series of experiments to validate the expression of our constructs as well as the functionality of our system. The results are presented in the following sections.
Characterization of the natural LldR promoter
Overview
Figure 1. The mechanism of repression of the lldR-promoter by LldR is thought to rely on DNA looping, which prevents the RNA Polymerase from transcription. The repression is removed in the presence of lactate.
For the sensing of Lactate inside our system we have a constitutive expression of the L-lactate dehydrogenase regulator, LldR. LldR is a protein which binds to two operator sites, operator1 (O1) and operator2 (O2), that flank the natural LldR promoter. This interaction forms a DNA loop, which does not allow the polymerase to transcribe the respective gene. Once Lactate is added to this system, it sequesters LldR, which can then no longer repress the promoter. Thus the gene of interest can be expressed [Aguilera 2008].
An improvement to our system, which was shown by the modeling to be important for enhanced sensitivity to low levels of lactate, is the addition of the L-lactate permease, LldP, a protein which is known to insert into the membrane and increase the import rate of lactate into the cell [Aguilera et al, 2008].
We characterized the natural version of the lldR-promoter regarding its response to a large concentration range of L-lactate in a microtiter plate reader setup.
Results
Surprisingly, what we found was not the expected release from the repression of LldR in the presence of Lactate. Indeed, if no LldR is present in the cell, according to the previous model, the levels of fluorescence should be equivalent as when there is high Lactate and LldR. We can clearly observe additional activation of GFP production! Especially for BBa_K1847007 and BBa_K1847009 the levels of normalized fluorescence upon introduction of lactate into the system containing LldR rises clearly above levels observed without LldR1. This interesting finding leads us to reinterpret the present model. Instead of having only repression by LldR, it seems that LldR is required for the transcription machinery. LldR would play a dual role as an activator and as a repressor, as discussed previously by [Aguilera 2008] without experimental support. That made us think that we need to adapt our model to accomodate this interesting and previously unexplored finding.

As mentioned above, we then introduced the lactate symporter lldP into our system. Expression of LldP and LldR are present in the natural operon structure, the result of which may be rather low levels of LldR in constructs also containing LldP, when compared to the experiment shown above in which there is no lldP (see the table below).
Figure 3. In the presence of L-Lactate, LldR mediates the activation of the gene of interest controlled by the lldR-promoter. The exact mechanism of this process has not been characterized in the literature.
Table 1: Estimation of the translation initiation rates (TIR) of LldR and LldP in our different test constructs. Levels were calculated using the Salis Lab Ribosomoe Binding Site Calculator in combination with the comparative promoter strength provided with the Anderson promoter collection. For simplification, when the promoter is BBa_J23114 we will refer to it as "low", if it is BBa_J23118 it will be referred to as "medium", and if it is BBa_J23100, it will be "high".
| Construct | TIR of LldR(A. U.) | TIR of LldP(A. U.) |
|---|---|---|
| LldR | 51100 | - |
| Low LldP- lldR | 664 | 8400 |
| High LldP- lldR | 12 | 23.4 |
Characterization of synthetic promoter library
Overview
To find the optimal regulatory system to integrate in our genetic circuit, we designed eight versions of the lldR-promoter that would be released from repression by LldR upon addition of Lactate. With our synthetic promoters we are planning to achieve higher sensitivity and reduced leakiness in respect to the natural version. We will remove the ArcA binding site to avoid unspecific regulation and will add LldR and LldP with higher expression levels than in the natural promoter, helping us to achieve the desired levels of expression. More information about the design process for these promoters can be found in our Part Collection
Table 2. Design of the promoter regulated by LldR based on the natural version (BBa_K822000) by introduction of different Anderson promoters. The columns represent different topologies of the promoters with their operator sites and the rows show the different Anderson promoters used. .
| O1-promoter-O2 | promoter-O1-O2 | promoter-O1-spacer-O2 | |
|---|---|---|---|
| J23117 | K1847008 | K1847005 | K1847003 |
| J23118 | K1847009 | K1847004 | K1847006 |
| J23100 | K1847007 | K1847002 | - |
| pLldR | K822000 | - | - |
For characterization of the promoter, we cloned all versions in front of a reporter-GFP. We then measured the sensitivity of our designed promoters to a range of Lactate concentrations by monitoring the GFP produced by our bacteria expressing constant LldR along with the nine reporter plasmids. Further information on the experimental setup can be found here.
We tested the following combinations of plasmids:
- a medium copy plasmid containing our designed lldR-promoters followed by a reporter GFP (lldRO1-J23117-lldRO2-B0034-sfGFP)
- the described medium copy plasmid and a low copy plasmid containing constant lldR (promoter (J23118)-RBS (B0034)-lldR (K1847001)-terminator (B0015))
- the described medium copy plasmid and a low copy plasmid containing constant lldR and constant lldP (low levels) (promoter (J23114)-RBS (B0032)-lldP-lldR (K1847016)-terminator (B0015))
- the described medium copy plasmid and a low copy plasmid containing constant lldR and constant lldP (high levels)(promoter (J23118)-RBS (B0034)-lldP-lldR (K1847016)-terminator (B0015))
For reasons of simplification, in the following we will refer to the genomic levels of LldR without overexpression from a plasmid as "no lldR".
Results
Initial experiments with all nine promoters showed a clear bias of functionality towards the three versions resembling the architecture of the natural lldR-promoter (data not shown). For further experiments we therefore focussed on these versions:
- natural version for reference BBa_K822000
- engineered PlldR with high promoter strength BBa_K1847007
- engineered PlldR with medium promoter strength BBa_K1847009
- engineered PlldR with low promoter strength BBa_K1847008
We were lucky to establish a collaboration with Stockholm, where they offered to characterize the less favorable designs for us. In the following we will only focus on the four most promising versions.
We continued to characterize our reduced set of promoters by recording dose response curves amongst a broad range of lactate concentrations. The first thing to test was whether or not our promoters actually respond to lldR as we expected them to, i.e. if GFP intensity would be properly repressed in the presence of lldR. The resulting data is shown in Figure 4.

Figure 4. Comparison of the three candidate synthetic promoters and the wild type version regarding their dose response to L-lactate in the presence or absence of LldR and LldP. A is BBa_K1847009 (low), B is BBa_K1847007 (high) and C is BBa_K1847008 (medium). The dose-response curves for our synthetically designed LldR-promoters over a four orders of magnitude range of lactate concentration (1 uM to 335 mM) was determined 7 hours after induction. Due to apparent toxicity of L-lactate indicated by slower growth rates, only the values below 100 mM were analyzed. Mead values are calculated with n=3 ± SD.
Comparison of low levels of LldR and LldP, to Figure 4B, representing high levels of LldR, can suggest either of two things:
- introduction of lldP into the system leads to leakiness due to uptake of possible traces of lactate in the medium
- the levels of LldR are too low to properly suppress the LldR-promoter even without presence of lactate
To discriminate these two possibilities we tested the system, as mentioned, with a higher expression of LldR and LldP obtained due to a medium strength Anderson promoter (BBa_J23118). The reduced level of leakiness despite higher levels of lldP suggests that the problem before was not import of lactate from the medium (which should not be present anyways) but due to insufficient levels of LldR and therefore lack of proper repression in absence of lactate.
Based on these results we decided to use BBa_K1847008 in our final system since its high ON/OFF ratio with a value of 15.27 allows for sensitivity in the range in which we expect the lactate output of our cancer cells to be located. Additionally we showed that introducing the permease lldP increased sensitivity of our system to lactate. Further validation showed that lactate from mammalian cell can be sensed in presence of lldP. All in all, we designed a promoter which is repressed by LldR and activated by L-lactate and responds with an increased sensitivity compared to the wild-type promoter.
Increased sensitivity for single cell lactate output
Overview
We wanted to test if the lactate levels produced by our mammalian cells would be high enough to trigger GFP expression from our reporter plasmid, and whether or not there would be crosstalk between wells containing mammalian cells and wells without them. We combined bacteria and Jurkat or 3T3 cells, respectively, in our chip and recorded the bacterial growth along with the GFP fluorescence in 16 wells for 7 hours. We did the same experiment in absence of mammalian cells as a negative control.
Results
The results obtained from the lactate detection measurements within our nanowellplate show a clear increase of normalized fluorescence over time.

Figure 5. E.coli sensing lactate produced Jurkat cells in the chip in RPMI medium: E.coli harboring the same promoter PLldR and either LldR or LldPR were introduced in the chip with and without Jurkat cells.
To compare the responses of E. coli in RPMI or DMEM medium, we performed the same experiments as described previously with for our bacteria in these two media in a 96-well plate using our microtiter plate reader (see Figure 6).

Regarding the cross-reaction of bacteria in wells without mammalian cells we found that lactate will easily diffuse in the medium covering the chip. In further experiments, the coverslip covering the filled nanowellplate should be sealed more tightly in order to prevent a continuous phase of medium covering and therby interlinking the different wells. Nevertheless, contol experiments without mammalian cells in the chip clearly showed that there is no self activation by bacteria within a chip that is devoid of mammalian cells (see Figure 5). This is consistent with our finding that E. coli cells do not produce significant levels of lactate themselves.
Characterization of the lacI-lldR promoter
Overview

For the establishment of a fold change sensor topology, a gateway integrating a positive and a delayed negative signal is required. For our system we engineered a hybrid promoter integrating repression by LacI and LldR. The two signals come together to influence our newly designed hybrid promoter in which we combined the Lac promoter with its operator (lacO) in the LldR operator promoter. We designed two hybrid promoters using different versions of the lac promoter. A closer description of the design process for these promoters can be found in our Part Collection.
We tested both of our synthetic hybrid promoters for their leanikess and response to L-lactate, as well as IPTG. The setup of this experiment was a strain containing the following constructs.
- a reporter GFP under the control of our hybrid promoter (lldRO1-plac-lacO-lldRO2-B0034-sfGFP or lldRO1-plac-lacO-lldRO2-B0034-sfGFP
- constantly expressed lldR and lldP (J23118-B0034-lldP-lldR-B0015)
- constantly expressed LacI (J23109B0034LacI)
Results
The promoter responded to both lactate and IPTG, as can be seen in Figure 8.

Figure 8. Heat map showing the fluorescence intensity depending on the concentration of the lactate and IPTG for Plac-lldR

Figure 9. Heat map showing the fluorescence intensity depending on the concentration of the lactate and IPTG for PlacUV5-lldR.
These results show that one of our combined promoters, Plac-lldR (K1847010), reacts in an AND gate fashion to a combination of lactate and IPTG. Only in presence of both input signal there is high expression of the reporter GFP. We hereby show that our synthetically engineered hybrid promoter Plac-lldR exhibits the desired behavior which will be favourable for the establishment of an AND gate in our fold change sensor, with an ON/OFF ratio of 15. The second hybrid promoter we designed, PlacUV5-lldR (K1847011), does not show the desired behavior in response to IPTG. A possible reason for this could be that the optimized LacUV5 promoter is changed in respect to Plac in a way that relies on free accessibility of the operator, which might no longer be given if there is LldR interacting with the LldR-operators close by.
What can be observed in Figure xx is that the repression due to LldR is much tighter in the absence of lactate, than the repression due to LacI in the absence of IPTG. A possible explanation for this may be found in the mechanism, which is thought to mediate the formation of a DNA loop [Aguilera 2008]. It is also possible that lactate acts as an additional activator for the responding promoter. Additionally, upon addition of lactate, the loop is resolved, which might be necessary for LacI to excert its inhibitory effect. Further experiments including the reaction of the hybrid promoters to LacI in absence of LldR are required for more detailed conclusions.
Quorum sensing module: influence of AHL degradation
Overview
The basis of quorum sensing is the leaky production of N-acyl homoserine lactone (AHL) in absence of an external cue which is crucial to allow for basal levels of AHL needed to trigger quorum sensing upon colocalization of several bacteria. Unfortunately, this leakiness interferes greatly with our system, since the main point of a binary signal like we want it, is the tightness in absence of a trigger. We thought of several strategies to deal with this issue. One option was the introduction of AHL degradation which would help us eliminate basic production levels of AHL. We therfore included constitutive expression of the AHL Lactonase AiiA in our design. To validate our design, we tested the influence of AHL degradation on the sensitivity to a large range of AHL concentrations.
We tested the response to AHL for the following genetic setups:
- a reporter GFP under control of Plux (pluxR (R0062)-RBS (B0034)-sfGFP)
- a reporter GFP under control of PluxR along with constitutive LuxR (pluxR (R0062)-RBS (B0034)-sfGFP-terminator (B0012), promoter (J23118)-RBS (B0032)-LuxR (C0062)-terminator (B0012))
- a reporter GFP under conrol of Plux along with constitutive LuxR and constitutive AiiA (plux (C0062)-RBS (B0034)-sfGFP-terminator (B0012), promoter (J23118)-RBS (B0032)-LuxR (C0062)-terminatr (B0012), promoter (J23118)-RBS (B0034)-aiiA (C0160))
Results
Our experiments comparing the dose-response of our system to AHL in the presence or absence of AiiA provided us with valuable results and parameters for the model, especially regarding apparent KM values:

|

|
||||
|
|
Figure 10. Comparison of the dose-response curve A: in absence and B: in presence of AiiA. Experimental data points and solid line for fitted curves of AiiA. GFP fluorescence was measured 7 hours after induction with various AHL concentrations. Values for the apparent KM values are given for both cases as mean fluorescence value with n=3 ± SD.
AHL degradation by AiiA shifts the curve by five orders of magnitude towards lower sensitivity, i.e. a higher KM value. We calculated the apparent half maximum substrate concentration for both cases: with (106 nM) and without (9.983 nM) AiiA. The characterization of AiiA provided by these results indicate that the KM of Plux can be tuned over a big range of concentration by adaption of the expression levels of AiiA, since in our experimental setup we are comparing the absence of AiiA with a high level of AiiA, leaving a lot of freedom to adaption of the levels of expression.
Upon comprehensive modeling of our system including the parameters gained from this study we could show that AHL degradation may solve our problem of leakiness of AHL production encountered in our system. However, to overcome the AHL degradation at high levels of AiiA, our cells would have to produce very high levels of AHL as well, which will be impossible in practice due to the limited number of bacteria in our singel cell analysis setup. Lowering the levels of AiiA would allow for sensitivity in the desired range of AHL. However, it will prevent the buildup of high enough gradient in AHL levels between bacteria colocalized on a cancer cell as opposed to E. coli cells floating freely in the bulk. We therefore decided not to rely on AHL degradation for our final system. Instead, we focused on the optimization of our AND gate.
Tightness of the AND gate between lactate module and AHL module
Overview
The ultimate goal of our system's setup is to receive a binary signal combining two independent indicators of CTC presence. The biggest hurdle in this was the leakiness of the quorum sensing system around LuxR. We therefore decided to arrange our two modules (the Lactate Sensor and the AHL module) in a sequential way in our system.
Results
We are working hard on last minute results!
Establishing a system for display of Annexin V on E. coli outer membrane
Overview
We conceptualize our Microbeacon system to rely on bacteria binding to cancer cells as a detection signal. The solution that we propose is to use Annexin V expressed on the outer membrane to bind cancer cells. Annexin V binds to phosphatidylserine (Leventis, 2010), which is a membrane lipid usually found in the inner part of the cell, but in cells undergoing apoptosis it is exposed to the outer membrane due to the activity of flipases (Leventis, 2010).
Annexin V is a soluble protein which has an unknown role in mammalian cell except its binding properties to membrane components(Gerke et al, 2002). As we want to express Annexin V in the outer membrane we need a protein that will export it. For this purpose we chose INP and changed the YFP, present in the part (BBa_K523013), for a human Annexin V protein optimized for Escherichia coli codon usage (ThermoFisher Scientific GeneOptimizer(R)). We used a strong RBS (BBa_B0034), a low expression promoter (BBa_J23114) and a low copy plasmid with a pSC101 origin of replication to avoid an excessive stress for the cell, as it is a membrane protein.
Results
To test our construct we used:
- J23114-B0032-INP-Annexin V in pSEVA371 (low copy plasmid)expressing RFP in TOP10 cells
- J23114 expressing RFP in TOP10 cells
As a first test, we did an assay with beads. We used magnetic beads coated with Protein A, which we incubated with monoclonal mouse anti-Annexin V antibodies (Affimetrix) for 30 min and then with the bacteria with different constructs. Unfortunately, we were not able to detect binding of our cells. We also did a Western blot to analize the expression of our construct using our anti-Annexin V antibody (Affimetrix) and we observed no band at the height where Annexin V is expected (35.9 kDa).
We wondered what could have gone wrong, so we checked with an RBS calculator (Salis et al, 2015) whether the expression would be high enough with our design. There, we realized that Annexin V showed a very low calculated translation initiation rate, which might indicate low or no expression. Using B0032 with INP-Annexin V we were getting a translation initiation rate of 410 a.u., while if we changed the RBS to B0034, we would get 12 000 a.u. Therefore, we changed the RBS of INP-Annexin V and Annexin V to B0034. As can be seen in Figure 5 we can see a band at the expected 35.9 kDa. This confirms the expression of Annexin V in our cells. Even though the band is weak, which we expected for low expressed membrane proteins, it indicates that INP-Annexin V is also expressed, which can be seen with a band at the corresponding 70.4 kDa. To confirm that INP-Annexin V was on the membrane fraction we run both the unclarified cell free extract (called crude from now on) of each sample and the supernatant of the centrifuged sample. Annexin V is present in both fractions, while INP-Annexin V is only visible in the crude fraction (Figure 5), likely to be part of the membrane containing cell debris.

Figure 11. Western blot image of B0034-Annexin V and B0034-INP-Annexin. Samples of Annexin V and INP-Annexin V were loaded both with a low copy plasmid (pSEVA371) and a high copy plasmid (pSB1C3). Each time a sample of the crude and of the supernatant were loaded on the gel. Detection was performed with a monoclonal mouse anti-Annexin antibody with a secondary goat anti-mouse antibody labelled with Alexa 488.
For the visualization of the Western Blot, we were forced to increase the sensitivity of the film a lot, which might indicate that the concentrations of the protein inside the cell are very low or that our primary antibody is not functioning too well.
INP-Annexin V externalization
Overview
After proving expression of our INP-Annexin V construct it is also crucial to test for it's functionality. We did so by using Protein G coated Dynabeads loaded with an anti-Annexin V antibody. The detailed protocol can be found in the experiments section.
We prepared two possible datasets:
- Beads without loaded antibody. Five different conditions were compared:
- INP-Annexin V-RFP in a high copy plasmid
- INP-Annexin V-RFP in a low copy plasmid
- RFP in a high copy plasmid
- Annexin-Alexa 488 purified
- PBS
- Beads with loaded antibody.
- INP-Annexin V-RFP in a high copy plasmid
- INP-Annexin V-RFP in a low copy plasmid
- RFP in a high copy plasmid
- Annexin-Alexa 488 purified
- PBS
After incubation of the antibody coated beads with the respective bacterial strain or control, we observed our beads using the microscope.
Results
First thing we did was to check the positive (Alexa-488 and beads with antibody and Alexa-488) and negative controls (beads without antibody). We found out that there was no green fluorescence in the positive control, confirming again our fear that the anti-Annexin antibody we are using is not binding as expected. Neither of our samples presented fluorescence from the secondary antibody either. We therefore concluded that the antibody was not very effective to detect annexin bound to another molecule. We came back to our Western blot (see Figure 11), where we used the same antibody, and saw that there were some unspecific bands at about 55 kDa. Also, the expected bands were very weak.
As can be seen in Figure 12, no difference can be seen in fluorescence levels of the beads. Moreover, bacteria have a similar size to bacteria (2.8 µm and 2 µm, respectively), so they would be seen in the microscopy picture if they were there.

Figure 12. Experiment for binding beads to anti-Annexin V antibody with four different conditions: INP-Annexin V-RFP in high copy plasmid, INP-ANnexin V-RFP in low copy plasmid, RFP in high copy plasmid and a negative control (no Annexin V).
INP-Annexin V functionality
Overview
A properly expressed and exported Annexin V protein is the first step towards a bacterial apoptosis detection system. However, the validation of the functionality of Annexin V in this construct is also crucial. We therefore tried several approaches to prove functionality of this construct regarding binding to apoptotic cells. For easy monitoring of our bacteria, we introduced an RFP construct into the same plasmid carrying INP-Annexin V. We published this construct in the registry to allow future iGEM teams to use our bacterial apoptosis detector (BBa_K1847015) for their project.
Results and Discussion
The first atempt we took were beads coated in phosphatidyl serine, which would simulate the surface of an apoptotic mammalian cell. Unfortunately, we were not able to detect binding of Annexin-Alexa 488 or bacteria to these beads.
However, these results cannot be taken as a total disproval of our system, since it is not clear how well the phosphatidylserine (PS)-coated beads simulate an apoptotic cell. We came up with the following possible explanations as to why this setup might not be ideal:
- It is possible that too high concentrations of PS (85 pM) on the beads interferes with the Annexin V-PS interaction.
- The hydrophobic tails of PS might form clumps if they are not embedded into a membrane, thereby hindering interactions.
- The biotin moiety required to bind PS onto the beads might be positionned on the lipid such that the interaction with Annexin V is no longer possible
But this initial backset could not stop us! We decided to try a more realistic setup, testing the binding of our E. coli cells expressing the INP-Annexin V construct to actual cancer cells. The results of this experiment can be found here.
Experiments involving mammalian cells
Our first step needed to check the viability of our experimental set-up was to confirm the data found in the literature regarding the sensitivity to TRAIL [Thomas, 2008] and the elevated lactate production observed in cancer cells, but not in non-cancer cells.
Sensitivity to TRAIL
Background
Apoptosis can be induced through a protein called TNF-related Apoptosis Inducing Ligand (TRAIL). TRAIL is a transmembrane protein, which can be found also in solubilised form (sTRAIL)[de Bruyne et al, 2013 ], that recognizes the death receptors DR4, DR5, DCR1, and DCR2 [Johnstone et al, 2008] and has been used in cancer treatment inducing the apoptosis of cancerous cells but with low cytotoxicity for healthy ones [Johnstone et al, 2008; Zhang et al, 2005].
Experiment overview
The first signal in our system is based on making cancer cells apoptotic while non-cancer cells remain untouched. Due to the properties of TRAIL explained before, we used it for a selective apoptosis induction in cancer cells.
The aim of this experiment was to check if cancer cells effectively undergo apoptosis after incubation with TRAIL and how long the incubation should last.
To test the predisposition of cancer cells to TRAIL-induced apoptosis we chose Jurkat cells, which are an immortalized human T lymphocyte cell line; and HL-60 cells, a line derived from acute myeloid leukemia. For a control with healthy cells we used a murine fibroblast cell line (3T3).

Methods and Results
Our first experiment consisted in incubating Jurkat and 3T3 cells with TRAIL for 4h and 6h (see protocol about apoptosis sensibility). Concentrations of 0, 50 and 100 ng/mL of TRAIL were used with each cell line. A positive control for Jurkat cells was applied by incubating these cells with PMA and ionomycin overnight Park et al, 2001 . After that, FACS analysis was performed. To differentiate between apoptosis and necrosis, PI dye was used to stain necrotic cells Rieger et al, 2011 . Apoptotic cells were detected by using Annexin V labelled with Alexa 4881).
Unfortunately, despite doing several trials in which we incremented the number of hours for incubation (up to 48h) and tried different concentrations of TRAIL, we were not able to replicate the results we found in the literature [Johnstone et al, 2008; Zhang et al, 2005]. To see where the problem was, we decided to incubate the cells with 1000 ng/mL of TRAIL over a period of 48 h. If our TRAIL was functional, we would expect to see a change in the cell's morphology after this time, indicating that our cells are apoptotic but our Annexin V-based detection system is not working, despite apoptosis being properly induced. If TRAIL was not functional, we expect not to see morphological differences. After the 48h we saw that there were no differences in the morphology of the cells, which lead us to suppose that probably the sTRAIL we bought was not working as expected.
Our next step was to purchase another TRAIL called SuperKillerTRAIL, for which we found promising entries in the literature [Mandal et. al (2014)]. To check whether this time our experiments were working, we added 100 ng/mL of TRAIL to Jurkat cells and measured the apoptosis at 2 h and 4 h. We observed that in 2 h apoptosis increased from about 2% of the population in non-treated samples to almost 70% in cells incubated with TRAIL. After 4 h the apoptotic cell number increased up to 75% (see Figure 1). As the number of apoptotic cells is increasing slowly after 2 h, we decided to use this as our standard time for TRAIL incubation.

Once we confirmed that TRAIL was effectively inducing apoptosis in Jurkat cells, we wanted to do the complete experiment, in which we determine the concentration of TRAIL we will use in future experiments and contrast Jurkat cells with 3T3 (a non-cancerous cell line).
Jurkat cells and 3T3 were incubated for 2 h in 0, 10, 50 and 100 ng/mL of TRAIL. Then, we followed the protocol detailed in Experiments. Annexin V was added to detect apoptosis, as it binds to phosphatidylserine which is found in higher proportion in apoptotic cells. To differentiate apoptotic and necrotic cells, PI dye was added. Annexin V and PI were detected by an emission filter at 488 and 561 nm, respectively.
Our data shows that 3T3 are not affected by TRAIL after 2h, whereas Jurkat cells are (as have been shown in the previous experiment). For Jurkat cells we decided to use a concentration of 100 ng/mL, as it allows to have a higher number of apoptotic cells in a relatively short amount of time (2 h).


Figure 14. 3T3 (upper image) and Jurkat cells (lower image) with 0, 10, 50 and 100 ng/mL of TRAIL after 2 h incubation. Annexin V-Alexa488 (488 nm) was used to detect apoptotic cells. To differentiate necrotic cells, PI was added (561 nm).
In Figure 14 in the upper image, for 0 and 50 ng/mL one can see that there is no necrotic cells (Q2). This is probably due to a mistake in manipulation, and these sample lacked PI.
Finally, to check if it was also possible to see apoptotic cells labelled with Annexin V in the microscope, we did an experiment with four conditions. One sample had no TRAIL and no Annexin V; the other had no TRAIL and Annexin V; the next had TRAIL and no Annexin V; and the final had both TRAIL and Annexin V.

As we expecteed, the only sample that had fluorescence at 488 nm was the one with both TRAIL and Annexin V.
Lactate production
Experiment overview
A lot of cancer cells ungergo a metabolic transition, called Warburg effect, where they do the aerobic glycolysis to obtain ATP. A subproduct they generate in this kind of energy production id L-Lactate (Vander et al, 2009). Therefore, the excretion of Lactate by cancer and healthy cells is different enough to be used as an indicator of cancer.
First, we wanted to check the how the production rates of lactate would vary in healthy and cancer cells. To this end, we analysed the medium in which our cells of interest had been incubated for a defined time in a defined seeding density. For detection of lactate in a sample, we used a L-lactate kit (Megazyme), in which two enzymatic reactions lead to a measurable concentration of NADH proportional to the Lactate content of the sample, which can then be measured as optical density at 340 nm (OD340). The kit was used applying the provided protocol.
Methods and Results
We used Jurkat cells as our cancer cells, 3T3 as our control for non-cancer cells and we also measured the concentration of lactate in bacteria. We expected the Jurkat cells to produce more lactate than the 3T3 and the bacteria to produce none.
The first problem we came across measuring the absorbance was the phenol red of the medium of the mammalian cells, which absorbs at the same wavelength as the lactate kit. Once the phenol red was removed, there was still another problem: a component of the medium seemed to react with our kit. After a bibliographic search, we decided that removing FBS from the medium was our best chance to get reliable calibration curves and measurements (researchgate.net). We also incorporated a centrifugation step after the collection of the sample to remove any cell that could stay in suspension.
In the case of bacteria, we wanted to take into consideration their fast growth compared to mammalian cells, so we measured the OD600 at each time point to have a correct normalization.
Lactate concentrations were first measured per well, and then normalized by the number of cells present in the well (see protocol about the measurement of Lactate in mammalian cells). The results can be seen in Figure 4.
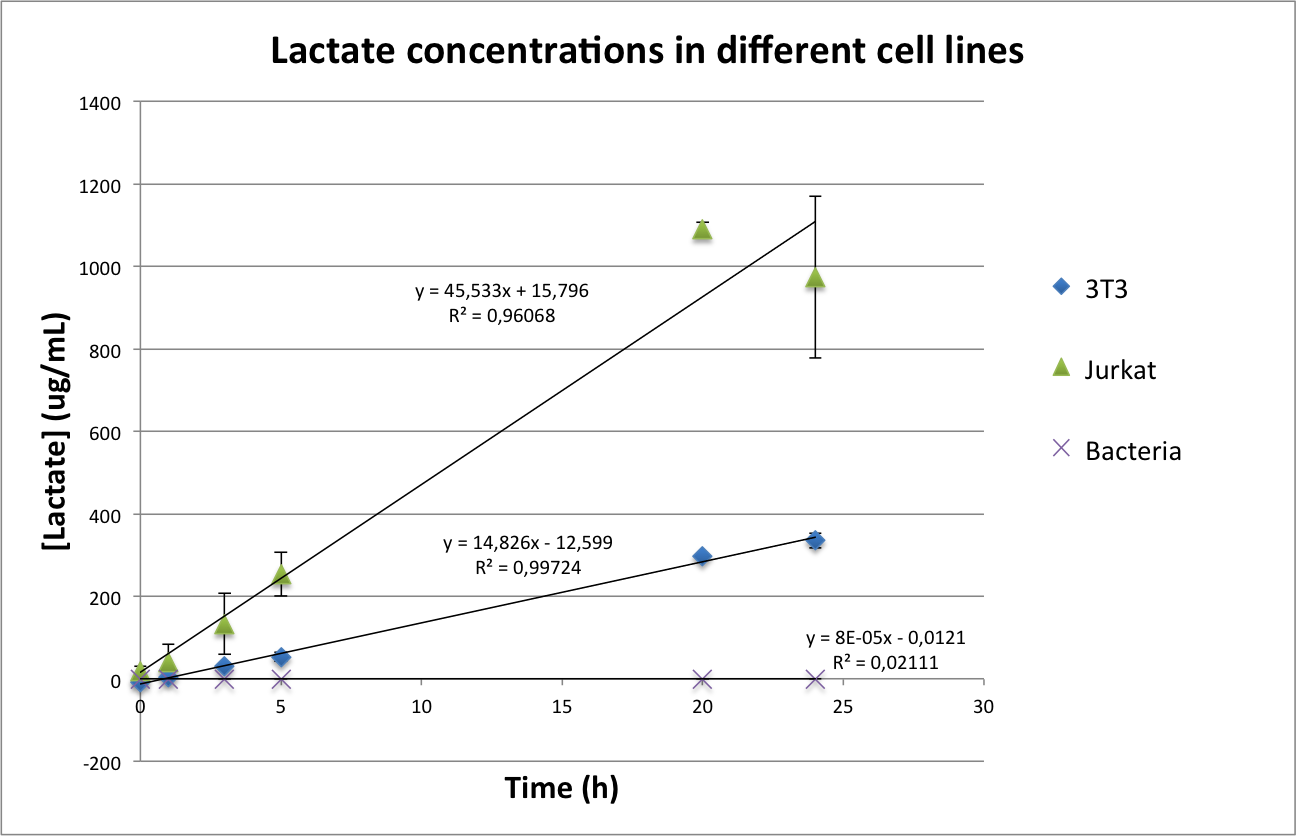

Figure 16. Total concentration of lactate in a well of a 96-well plate (upper image) and normalized values of lactate per cell(lower image).
As can be seen in Figure 16, in the case of bacteria our results confirm the first hypothesis according to which bacteria do not produce lactate. However, they seem to contradict the presence of Warburg effect, as the concentration of lactate per cell is higher in 3T3 than in Jurkat cells. We came across some possible explanations for this phenomenon:
- 3T3 is a murine cell line, while Jurkat cells are a human cell line. It could be possible that basal murine lactate levels are higher than in humans. For checking this hypothesis, we wanted to use human fibroblasts. Unfortunately, none of the labs of our department had any adequate cell line for our purposes and due to time constrains we could not ask other departments.
- 3T3 are adherent cells, while Jurkat cells are non-adherent. Although both cell lines were seeded for not reaching confluency in the next two days it is still possible that the different cell density influenced the metabolism and therefore the lactate production.
In conclusion, we consider that the choice of the 3T3 as a control line was not our best option, but was done due to availability of the cell line and our inexperience using mammalian cells. For future experiments, we want to change our control cell line to produce more conclusive data.
1) During the process of necrosis, parts of the inner cell membrane leaflet are exposed to the environment, including phosphatidylserine. Therefore we also expect some Annexin-positive cells in the absence of apoptosis.
Mammalian cells and bacteria combined
Co-culture of mammalian cells with bacteria
Overview
One issue that was concerning us was the possibility that the mammalian cells would behave in unusual ways in presence of bacteria. To exclude this possibility we decided to co-culture mammalian cells with bacteria for 3 h which is the time we expect that our test will last.
We used E. coli expresssing GFP and for the mammalian cell lines we used 3T3, HL-60 and Jurkat lines.
Results
We could observe that after the set time point (3 h) the 3T3 cells incubated with GFP-expressing bacteria had the same morphology as in the control. However, in Jurkat cells, it was possible to see some unspecific binding of bacteria to the cells.

Figure 17. Co-culture of 3T3 and Jurkat cells without and with bacteria expressing GFP after 3h of incubation.
Detection of apoptotic cells by our engineered bacteria expressing Annexin V
Overview
The ultimate goal of the introduction of our INP-Annexin V construct into E. coli is to make our MicroBeacons bind to apoptotic cancer cells. In order to prove this, we induced apoptosis in Jurkat and HL60 cells by incubating them with 100 ng/mL for 2 hours before combining them with our engineered bacteria. The final analysis was performed using microscopy. We verified apoptosis using Annexin V-Alexa488 staining.
Results
Unfortunately we were unable to show binding of our E. coli cells to apoptotic cells. On the contrary, it seemed that our bacteria bound preferrentially to non-apoptotic cells. We peformed an extensive series of experiments to achieve better results, adapting incubation time with the bacteria (1 h, 2 h, 3 h), calcium concentration of the Annexin binding buffer (0.25 mM, 2.5 mM, 25 mM) and incubation temperature with the bacteria (4ºC, 25ºC, 37ºC). Still, it seems that our bacteria (both with and without the INP-Annexin construct (BBa_K1847015) are only bining to healthy cells and only under low concentrations of calcium. Our previous coculture experiments, however, showed that in complete absence of calcium the bacteria are not sticking to mammalian cells.
We are currently looking into alternative ways to get Annexin V exposed on the surfcae of our E. coli.
Detection of apoptotic cells by our engineered bacteria using autodisplay
Overview
As we could not prove the externalization of Annexin V by INP, we changed the strategy to use an Autodisplay system. Autodisplay consists in a beta-barrel that folds on the cell membrane putting outside of the cell the construct of interest.
Results
Results with Autodisplay were more promising than with INP. The bacteria that contained the Autodisplay system bound to the cells when compared with bacteria containing only RFP. Binding did not seem to be specific to cancer cells. However, we consider that due to the manipulation of the sample (incubation of the cells without a CO2 pressure and at room temperature) could trigger apoptosis in the samples treated and not treated with TRAIL. More experiments will be needed to see if specific bnding to cancer cells can be finally achieved.

Figure 18. Cells expressing Annexin V with an Autodisplay system compared to cells containing only RFP.


We would like to thank our sponsors


