Difference between revisions of "Team:Waterloo/Modeling/CaMV Replication"
m (Started with motivation...) |
m (Added state variable list) |
||
| (48 intermediate revisions by 5 users not shown) | |||
| Line 1: | Line 1: | ||
{{Waterloo}} | {{Waterloo}} | ||
<html> | <html> | ||
| − | <div | + | <div class="container main-container"> |
| − | + | ||
| − | + | ||
<h1>CaMV Replication</h1> | <h1>CaMV Replication</h1> | ||
| − | < | + | <section id="motivation" title="Motivation"> |
| − | + | <div class="row"> | |
| − | Intracellular replication of CaMV may be strongly affected by the addition of CRISPR/Cas9 and in turn | + | <div class="col-sm-8"> |
| − | </p> | + | Intracellular replication of CaMV may be strongly affected by the addition of CRISPR/Cas9 and in turn may influence viral spread. Therefore, it's crucial for us to accurately model the replication process to predict viral production over time. In this way, our model of replication will connect our work on <a href="https://2015.igem.org/Team:Waterloo/Modeling/Cas9_Dyanmics">CRISPR/Cas9 Dynamics</a> with our agent-based modelling of <a href="https://2015.igem.org/Team:Waterloo/Modeling/Intercellular_Spread">Intercellular Viral Spread</a>. The first goal of the model is to demonstrate the reduction of viral load over time due to CRISPR/Cas9 modification of ORFVI. This reduction in viral load will hopefully allow for plant defenses to effectively contain the virus before the onset of systemic infection.</p> |
| + | </div> | ||
| + | <div class="col-sm-4"> | ||
| + | <figure> | ||
| + | <img src="/wiki/images/9/98/Waterloo_mathVA_graphic.svg" alt="Stylized genome" style="width:200px;"/> | ||
| + | <figcaption class="model-caption">Plant Cells</figcaption> | ||
| + | </figure> | ||
| + | </div> | ||
| + | </div> | ||
| + | <p>This leads to our second goal which is to integrate the intracellular replication and intercellular spread models to fully understand impact of CRISPR/Cas9. Altogether, we are attempting to demonstrate the feasibility of our anti-viral system and use our findings to direct the project design. </p> | ||
| + | </section> | ||
<section id="formation" title="Model Formation"> | <section id="formation" title="Model Formation"> | ||
<h2>Model Formation</h2> | <h2>Model Formation</h2> | ||
| − | + | <div class="row"> | |
| − | + | <div class="col-sm-8"> | |
| − | + | <p>There are several core processes involved in CaMV replication within an infected host cell. The details of CaMV replication are discussed on the <a href="https://2015.igem.org/Team:Waterloo/Modeling/CaMV_Biology">CaMV Biology</a> page and shown in the figure. In brief, however, we determined that in addition to typical processes such as transcription, constitutive translation, and degradation we must also account for the following processes in our model:</p> | |
| − | + | ||
| − | + | ||
| − | + | ||
| − | + | ||
| − | + | ||
| − | + | ||
| − | + | ||
| − | + | ||
| − | + | ||
| − | + | ||
| − | + | ||
| − | + | ||
| − | + | ||
| − | + | ||
| − | + | ||
| − | + | ||
| − | + | ||
| − | + | ||
| − | + | ||
| − | + | ||
| − | + | ||
| − | + | ||
| − | + | ||
| − | + | ||
| − | + | ||
| − | + | ||
| − | + | ||
| − | + | ||
| − | + | ||
| − | + | ||
| − | + | ||
| − | + | ||
| − | + | ||
| − | + | ||
| − | + | ||
| − | + | ||
| − | + | ||
| − | + | ||
| − | + | ||
| − | + | ||
| − | + | ||
| − | + | ||
| − | + | ||
| − | + | ||
| − | + | ||
| − | + | ||
| − | + | ||
| − | + | ||
| − | + | ||
| − | + | ||
| − | + | ||
| − | + | ||
| − | + | ||
| − | + | ||
| − | + | ||
| − | + | ||
| − | + | ||
| − | + | ||
| − | + | ||
| − | + | ||
| − | + | ||
| − | + | ||
| − | + | ||
| − | + | ||
| − | + | ||
| − | + | ||
| − | + | ||
<ul> | <ul> | ||
<li>Virions reinfecting the nucleus</li> | <li>Virions reinfecting the nucleus</li> | ||
| Line 93: | Line 34: | ||
</ul> | </ul> | ||
<p>Additionally, since our project uses CRISPR to produce a targeted mutation in the P6 gene, we track both wild-type and mutated versions of genomes, pregenomes, and virions.</p> | <p>Additionally, since our project uses CRISPR to produce a targeted mutation in the P6 gene, we track both wild-type and mutated versions of genomes, pregenomes, and virions.</p> | ||
| − | <h3>Network</h3> | + | </div> |
| − | <h4>DNA</h4> | + | <div class="col-sm-4"> |
| + | <figure> | ||
| + | <img src="/wiki/images/e/ee/Waterloo_CaMV_Replication.gif" alt="CaMV Replication" style="max-width:300px;" class="img-responsive"/> | ||
| + | <div class="img-att"> | ||
| + | i | ||
| + | <ul class="img-att-bubble"> | ||
| + | <li>Photo © <a href="http://onlinelibrary.wiley.com/doi/10.1046/j.1364-3703.2002.00136.x/full">Haas et al. (2005)</a></li> | ||
| + | <li>Figure 3 of <em>Cauliflower mosaic virus</em>: still in the news <cite ref="Haas2002"></cite></li> | ||
| + | </ul> | ||
| + | </div> | ||
| + | </figure> | ||
| + | </div> | ||
| + | </div> | ||
| + | |||
| + | <h3>Network and Equations</h3> | ||
| + | <p>The replication pathway of CaMV, simplified to contain only the processes of interest, is shown in the figure below. Gapped CaMV genomes ($g_{gap}$) are closed ($g_{cc}$) and modified by CRISPR/Cas9 ($g_{m.gap}$, $g_{m.cc}$). The modified genomes produce 35S transcripts $35S_m$, but do not produce P6, which is needed to activate translation of the $35S$ transcript into $P3$, $P4$ and $P5$. Proteins $P1$ and $P2$ are disregarded because they mostly play a role in aphid transmission, which we did not model.</p> | ||
| + | <figure> | ||
| + | <img src="/wiki/images/1/10/Waterloo_CaMV_Replication_Network_2.png" alt="CaMV Replication Network" class="img-responsive"/> | ||
| + | <figcaption>CaMV replication pathway, showing main steps of CRISPR/Cas9 modification, transcription, translation and viral packaging.</figcaption> | ||
| + | </figure> | ||
| + | <p>The proteins produced from either 35S transcript ($35S$ or $35S_m$) may be used to package virions, though virions produced from $35S_m$, while they are packaged and transported to other cells, will not be able to initiate infection due to their deactivated P6 gene. It should be noted that transport in and out of the nucleus is not modelled explicitly, though certain species only reside in the nucleus and others only in the cytoplasm.</p> | ||
| + | <p>The principles of mass-action kinetics, reviewed by Ingalls <cite ref="Ingalls2013"></cite>, were used to extract a series of ordinary differential equations from this network. The construction of the network and extraction of equations required a number of assumptions, which are detailed below.</p> | ||
| + | |||
| + | <div class="panel panel-default"> | ||
| + | <div class="panel-heading" role="tab" id="systemODEs"> | ||
| + | <h3 class="panel-title"> | ||
| + | <a class="collapsed" role="button" data-toggle="collapse" data-parent="#bio background" href="#collapseODEs" aria-expanded="false" aria-controls="collapseODEs"> | ||
| + | List of Ordinary Differential Equations | ||
| + | <span class="hidden-xs toggle-arrow pull-right">Panel Toggle</span> | ||
| + | </a> | ||
| + | </h3> | ||
| + | </div> | ||
| + | <div id="collapseODEs" class="panel-collapse collapse" role="tabpanel" aria-labelledby="systemODEs"> | ||
| + | <div class="panel-body"> | ||
| + | <h4>State Variables</h4> | ||
| + | <ul> | ||
| + | <li>$d_g$: Gapped DNA in nucleus</li> | ||
| + | <li>$d_{cc}$: cccDNA in nucleus</li> | ||
| + | <li>$d_{m.g}$: Modified gapped DNA in nucleus</li> | ||
| + | <li>$d_{m.cc}$: Modified cccDNA in nucleus</li> | ||
| + | <li>$r_{19S}$: 19S RNA</li> | ||
| + | <li>$r_{35S}$: 35S RNA</li> | ||
| + | <li>$r_{35Sm}$: Modified 35S RNA</li> | ||
| + | <li>$P_3$: Protein 3</li> | ||
| + | <li>$P_4$: Protein 4</li> | ||
| + | <li>$P_5$: Protein 5</li> | ||
| + | <li>$P_6$: Protein 6</li> | ||
| + | <li>$V_i$: Intermediate virions</li> | ||
| + | <li>$V_{im}$: Intermediate virions with modified genome</li> | ||
| + | <li>$V_m$: Modified virions</li> | ||
| + | <li>$V$: Virions</li> | ||
| + | </ul> | ||
| + | <h4>CaMV DNA</h4> | ||
| + | <p>CaMV DNA is present in both gapped and ungapped forms in the nucleus and may be converted to "modified" form by CRISPR/Cas9, which removes its P6 activity. There is assumed to be a carrying capacity for viruses within the nucleus because of limited cellular resources and the nucleus may be reinfected by virions packaged in the cytoplasm.</p> | ||
<p> | <p> | ||
$$\frac{d d_g}{dt} = k_v V (d_{max} - d_{total}) - \alpha_c d_g - k_g d_g - \gamma_d d_g$$ | $$\frac{d d_g}{dt} = k_v V (d_{max} - d_{total}) - \alpha_c d_g - k_g d_g - \gamma_d d_g$$ | ||
| − | $$\frac{d | + | $$\frac{d d_{cc}}{dt} = \alpha_c d_g - k_c d_{cc} - \gamma_d d_{cc}$$ |
| − | $$\frac{d d_{ | + | $$\frac{d d_{m.g}}{dt} = k_v V_m (d_{max} - d_{total}) - \alpha_c d_{m.g} + k_g d_g - \gamma_d d_{m.g}$$ |
| − | $$\frac{d d_{ | + | $$\frac{d d_{m.cc}}{dt} = \alpha_c d_{m.g} + k_c d_{cc} - \gamma_d d_{m.cc}$$ |
</p> | </p> | ||
<h4>RNA</h4> | <h4>RNA</h4> | ||
| + | <p>We consider three transcripts, all assumed to be of importance only in the cytoplasm. The 19S mRNA transcript, the 35S transcript and the modified 35S transcript. These transcripts are degraded both passively, according to the $\gamma_{19S}$ and $\gamma_{35S}$ parameters, and actively by the plant RNAi defenses, captured in the $\gamma_{r}$ term. The 35S transcripts are also packaged into virions by a P4/P5 complex present on the inclusion bodies.</p> | ||
<p> | <p> | ||
| − | $$\frac{d r_{19S}}{dt} = \alpha_{19S} | + | $$\frac{d r_{19S}}{dt} = \alpha_{19S} d_{cc} - (\gamma_{19S}+\gamma_{r}) r_{19S}$$ |
| − | $$\frac{d r_{35S}}{dt} = \alpha_{35S} | + | $$\frac{d r_{35S}}{dt} = \alpha_{35S} d_{cc} - k_p p_4 p_5 f_u r_{35S} - (\gamma_{35S}+\gamma_{r}) r_{35S}$$ |
| − | $$\frac{d r_{35Sm}}{dt} = \alpha_{35S} d_{ | + | $$\frac{d r_{35Sm}}{dt} = \alpha_{35S} d_{m.cc} - k_p p_4 p_5 f_u r_{35Sm} - (\gamma_{35S}+\gamma_{r}) r_{35Sm}$$ |
</p> | </p> | ||
<h4>Protein</h4> | <h4>Protein</h4> | ||
| + | <p>The concentrations of four proteins are modelled. Translation of P3, P4 and P5 from the either of the 35S transcripts occurs because of activation by P6, while P6 is translated from the 19S transcript. All transcripts proteins are degraded and P3, P4 and P5 participate in viral packaging.</p> | ||
<p> | <p> | ||
$$\frac{d p_3}{dt} = \beta_3 \left( \frac{p_6}{p_6+K_6} \right) (r_{35S} + r_{35Sm}) - k_a p_3 (V_i+V_{im}) - \delta_3 p_3$$ | $$\frac{d p_3}{dt} = \beta_3 \left( \frac{p_6}{p_6+K_6} \right) (r_{35S} + r_{35Sm}) - k_a p_3 (V_i+V_{im}) - \delta_3 p_3$$ | ||
| Line 115: | Line 111: | ||
</p> | </p> | ||
<h4>Virions</h4> | <h4>Virions</h4> | ||
| + | <p>The concentrations of four proteins are modelled. Translation of P3, P4 and P5 from the either of the 35S transcripts occurs because of activation by P6, while P6 is translated from the 19S transcript. All transcripts proteins are degraded and P3, P4 and P5 participate in viral packaging. Due to the complicated nature and relative lack of characterization of viral packaging, we decided in our model to combine the packaging reaction into one term, dependent on P4, P5, and unspliced 35S RNA concentration.</p> | ||
<p> | <p> | ||
$$\frac{d V_i}{dt} = k_p p_4 p_5 f_u r_{35S} - k_a p_3 V_i$$ | $$\frac{d V_i}{dt} = k_p p_4 p_5 f_u r_{35S} - k_a p_3 V_i$$ | ||
| Line 122: | Line 119: | ||
</p> | </p> | ||
<h4>Algebraic Equations</h4> | <h4>Algebraic Equations</h4> | ||
| + | <p>Not all equations pertinent to the dynamics are differential: in particular, the carrying capacity of genomes in the nucleus and effect of RNAi are modelled using algebraic equations.</p> | ||
<p> | <p> | ||
| − | $$d_{total} = d_g + | + | $$d_{total} = d_g + d_{cc} + d_{m.g} + d_{m.cc}$$ |
$$\gamma_r = \frac{L}{1+e^{k (p_6-x_0)}}$$ | $$\gamma_r = \frac{L}{1+e^{k (p_6-x_0)}}$$ | ||
$$x_0 = \frac{1}{2} p_6 ^{ss}$$ | $$x_0 = \frac{1}{2} p_6 ^{ss}$$ | ||
$$p_6 ^{ss} = \frac{\beta_6}{\delta_6} \frac{\alpha_{19}}{\gamma_{19}} d_{max}$$ | $$p_6 ^{ss} = \frac{\beta_6}{\delta_6} \frac{\alpha_{19}}{\gamma_{19}} d_{max}$$ | ||
</p> | </p> | ||
| + | </div> | ||
| + | </div> | ||
| + | </div> | ||
| − | <h3>Assumptions</h3> | + | <div class="panel panel-default"> |
| + | <div class="panel-heading" role="tab" id="modelAssumptions"> | ||
| + | <h3 class="panel-title"> | ||
| + | <a class="collapsed" role="button" data-toggle="collapse" data-parent="#bio background" href="#collapseAssumptions" aria-expanded="false" aria-controls="collapseAssumptions"> | ||
| + | Assumptions Contained in ODE Equations | ||
| + | <span class="hidden-xs toggle-arrow pull-right">Panel Toggle</span> | ||
| + | </a> | ||
| + | </h3> | ||
| + | </div> | ||
| + | <div id="collapseAssumptions" class="panel-collapse collapse" role="tabpanel" aria-labelledby="modelAssumptions"> | ||
| + | <div class="panel-body"> | ||
<ul> | <ul> | ||
<li>Cell concentrations are continuous</li> | <li>Cell concentrations are continuous</li> | ||
| Line 146: | Line 157: | ||
<li>Spliced and unspliced 35S RNA degrade at the same rate</li> | <li>Spliced and unspliced 35S RNA degrade at the same rate</li> | ||
<li>Encapsidation and reverse transcription occur simultaneously</li> | <li>Encapsidation and reverse transcription occur simultaneously</li> | ||
| − | <ul><li>Information for CaMV is lacking, but for HBV (another pararetrovirus) reverse transcription is initiated during encapsidation and encapsidation is initiated by RT <cite ref=" | + | <ul><li>Information for CaMV is lacking, but for HBV (another pararetrovirus) reverse transcription is initiated during encapsidation and encapsidation is initiated by RT <cite ref="Pollack1994"></cite>. The complexity of this packaging process is not fully captured in this model</li></ul> |
<li>Only unspliced RNA is packaged</li> | <li>Only unspliced RNA is packaged</li> | ||
<ul><li>Spliced RNA lacks P1 and P2 and so, although able to replicate within the cell, virions which package spliced RNA will be unable to propagate</li></ul> | <ul><li>Spliced RNA lacks P1 and P2 and so, although able to replicate within the cell, virions which package spliced RNA will be unable to propagate</li></ul> | ||
| Line 161: | Line 172: | ||
<ul><li>This is very well established <cite ref="Karsies2002"></cite></li></ul> | <ul><li>This is very well established <cite ref="Karsies2002"></cite></li></ul> | ||
<li>Virions leave the cell at a constant rate</li> | <li>Virions leave the cell at a constant rate</li> | ||
| + | </div> | ||
| + | </div> | ||
| + | </div> | ||
| − | + | <h3>Model Parameters</h3> | |
| − | + | <p> | |
| − | <table class="table table- | + | Finding and implementing accurate parameter values is crucial when trying to draw conclusions from a model. Our model contains nearly thirty parameters, each of which needed to be found to exactly reproduce the viral replication process <em>in silico</em>. Model dynamics may be drastically affected by our choice in parameters and this must be accounted for in our analysis. However, as with many models in systems biology our network suffers from the "parameter problem" described in chapter 1 of the book by Gunawardena <cite ref="Gunawardena2010"></cite> which arises from the complexity of biological processes and the difficulty in measuring parameter values.</p> |
| + | <p>A number of parameter values are the same as those used in an HBV model developed by Nakabayashi & Sasaki <cite ref="Nakabayashi2011"></cite>. Parameters that have a reference in the "Source" column are ones we were able to find or derive accurate values for from the literature. Unfortunately, there are a few parameter values that could not be found (e.g. the half-saturation constant of P6 activation) and so we explicitly mention the absence of data in the table. In order to compensate for the lack of accurate parameters, we analyze our model over a wide range of parameters to determine how behaviour will be affected.</p> | ||
| + | <p> Lastly, for simplicity we normalized each concentration by the volume of the cell (volume=1.414x10$^{-13}$m$^3$).</p> | ||
| + | |||
| + | <div class="panel panel-default"> | ||
| + | <div class="panel-heading" role="tab" id="paramTable"> | ||
| + | <h3 class="panel-title"> | ||
| + | <a class="collapsed" role="button" data-toggle="collapse" data-parent="#biobackground" href="#collapseTable" aria-expanded="false" aria-controls="collapseTable"> | ||
| + | Full Table of Parameters | ||
| + | <span class="hidden-xs toggle-arrow pull-right">Panel Toggle</span> | ||
| + | </a> | ||
| + | </h3> | ||
| + | </div> | ||
| + | <div id="collapseTable" class="panel-collapse collapse" role="tabpanel" aria-labelledby="paramTable"> | ||
| + | <div class="panel-body"> | ||
| + | <div class="table-responsive"> | ||
| + | <table class="table table-condensed"> | ||
<thead> | <thead> | ||
<tr> | <tr> | ||
| Line 180: | Line 210: | ||
<td>min$^{-1}$</td> | <td>min$^{-1}$</td> | ||
<td>Rate at which virions produced by the cell reinfect the nucleus.</td> | <td>Rate at which virions produced by the cell reinfect the nucleus.</td> | ||
| − | <td></td> | + | <td>No source found, parameter is further analyzed in the results section</td> |
</tr> | </tr> | ||
<tr> | <tr> | ||
<td>$d_{max}$</td> | <td>$d_{max}$</td> | ||
| − | <td>100 | + | <td>100</td> |
<td>molecules/volume</td> | <td>molecules/volume</td> | ||
<td>Maximum concentration of viral genomes in the nucleus.</td> | <td>Maximum concentration of viral genomes in the nucleus.</td> | ||
| − | <td></td> | + | <td>"Another pool of viral genomes, in the order of 10-100 copies of minichromosomes comprising supercoiled circular viral DNA and host histones, accumulates in the nucleus" <cite ref="Karsies2002"></cite></td> |
</tr> | </tr> | ||
<tr> | <tr> | ||
| Line 194: | Line 224: | ||
<td>min$^{-1}$</td> | <td>min$^{-1}$</td> | ||
<td>Rate at which gaps are repaired in gapped DNA to form cccDNA.</td> | <td>Rate at which gaps are repaired in gapped DNA to form cccDNA.</td> | ||
| − | <td></td> | + | <td>HBV model by Nakabayashi & Sasaki <cite ref="Nakabayashi2011"></cite></td> |
</tr> | </tr> | ||
<tr> | <tr> | ||
| Line 201: | Line 231: | ||
<td>min$^{-1}$</td> | <td>min$^{-1}$</td> | ||
<td>Rate at which the P6 gene on the gapped DNA is modified.</td> | <td>Rate at which the P6 gene on the gapped DNA is modified.</td> | ||
| − | <td></td> | + | <td>No source found, parameter is further analyzed in the results section</td> |
</tr> | </tr> | ||
<tr> | <tr> | ||
| Line 208: | Line 238: | ||
<td>min$^{-1}$</td> | <td>min$^{-1}$</td> | ||
<td>Rate at which the P6 gene on cccDNA is modified.</td> | <td>Rate at which the P6 gene on cccDNA is modified.</td> | ||
| − | <td></td> | + | <td>No source found, parameter is further analyzed in the results section</td> |
</tr> | </tr> | ||
<tr> | <tr> | ||
| Line 215: | Line 245: | ||
<td>min$^{-1}$</td> | <td>min$^{-1}$</td> | ||
<td>DNA Degradation rate.</td> | <td>DNA Degradation rate.</td> | ||
| − | <td></td> | + | <td>HBV model by Nakabayashi & Sasaki <cite ref="Nakabayashi2011"></cite></td> |
</tr> | </tr> | ||
<tr> | <tr> | ||
| Line 222: | Line 252: | ||
<td>min$^{-1}$</td> | <td>min$^{-1}$</td> | ||
<td>Transcription rate of 19S RNA.</td> | <td>Transcription rate of 19S RNA.</td> | ||
| − | <td></td> | + | <td>HBV model by Nakabayashi & Sasaki <cite ref="Nakabayashi2011"></cite></td> |
</tr> | </tr> | ||
<tr> | <tr> | ||
<td>$\alpha_{35S}$</td> | <td>$\alpha_{35S}$</td> | ||
| − | <td>0. | + | <td>0.09</td> |
<td>min$^{-1}$</td> | <td>min$^{-1}$</td> | ||
<td>Transcription rate of 35S RNA.</td> | <td>Transcription rate of 35S RNA.</td> | ||
| − | <td></td> | + | <td>HBV model by Nakabayashi & Sasaki <cite ref="Nakabayashi2011"></cite></td> |
</tr> | </tr> | ||
<tr> | <tr> | ||
| − | <td>$\gamma_{19S}$</td> | + | <td>$\gamma_{19S}$, $\gamma_{35S}$</td> |
<td>0.001</td> | <td>0.001</td> | ||
<td>min$^{-1}$</td> | <td>min$^{-1}$</td> | ||
| − | <td>Degradation rate of 19S RNA | + | <td>Degradation rate of 19S RNA, 35S RNA.</td> |
| − | + | <td>HBV model by Nakabayashi & Sasaki <cite ref="Nakabayashi2011"></cite></td> | |
| − | + | ||
| − | + | ||
| − | + | ||
| − | + | ||
| − | <td> | + | |
| − | + | ||
| − | + | ||
</tr> | </tr> | ||
<tr> | <tr> | ||
| Line 250: | Line 273: | ||
<td>unitless</td> | <td>unitless</td> | ||
<td>Fraction of unspliced 35S RNA in the cell (assumed at equilibrium).</td> | <td>Fraction of unspliced 35S RNA in the cell (assumed at equilibrium).</td> | ||
| − | <td>< | + | <td>Froissart et al. 2004 <cite ref="Froissart2004"><\cite> and Bouton et al. 2015 <cite ref="Bouton2015"><\cite></td> |
| − | + | ||
| − | + | ||
| − | + | ||
| − | + | ||
| − | + | ||
| − | + | ||
| − | + | ||
| − | + | ||
| − | + | ||
| − | + | ||
| − | + | ||
| − | + | ||
| − | + | ||
| − | + | ||
</tr> | </tr> | ||
<tr> | <tr> | ||
| − | <td>$\beta_5$</td> | + | <td>$\beta_3$, $\beta_4$, $\beta_5$, $\beta_6$</td> |
<td>0.1</td> | <td>0.1</td> | ||
<td>min$^{-1}$</td> | <td>min$^{-1}$</td> | ||
| − | <td>Translation rate of P5.</td> | + | <td>Translation rate of P3, P4, P5, P6.</td> |
| − | <td>< | + | <td>HBV model by Nakabayashi & Sasaki <cite ref="Nakabayashi2011"></cite></td> |
| − | + | ||
| − | + | ||
| − | + | ||
| − | + | ||
| − | + | ||
| − | + | ||
| − | + | ||
</tr> | </tr> | ||
<tr> | <tr> | ||
<td>$K_6$</td> | <td>$K_6$</td> | ||
| − | <td> | + | <td>5000</td> |
<td>molecules/volume</td> | <td>molecules/volume</td> | ||
<td>Half-saturation constant for transactivation of P1-P5 production.</td> | <td>Half-saturation constant for transactivation of P1-P5 production.</td> | ||
| − | <td></td> | + | <td>No source found, parameter is further analyzed in the results section</td> |
</tr> | </tr> | ||
<tr> | <tr> | ||
| − | <td>$\delta_3$</td> | + | <td>$\delta_3$, $\delta_4$, $\delta_5$, $\delta_6$</td> |
<td>0.001</td> | <td>0.001</td> | ||
<td>min$^{-1}$</td> | <td>min$^{-1}$</td> | ||
| − | <td>Degradation rate of P3.</td> | + | <td>Degradation rate of P3, P4, P5, P6.</td> |
| − | <td></td> | + | <td>HBV model by Nakabayashi & Sasaki <cite ref="Nakabayashi2011"></cite></td> |
</tr> | </tr> | ||
| − | |||
| − | |||
| − | |||
| − | |||
| − | |||
| − | |||
| − | |||
| − | |||
| − | |||
| − | |||
| − | |||
| − | |||
| − | |||
| − | |||
| − | |||
| − | |||
| − | |||
| − | |||
| − | |||
| − | |||
</tr> | </tr> | ||
<tr> | <tr> | ||
<td>$k_p$</td> | <td>$k_p$</td> | ||
<td>0.1</td> | <td>0.1</td> | ||
| − | <td> | + | <td>molecules$^{-2}$ min$^{-1}$</td> |
<td>Packaging rate.</td> | <td>Packaging rate.</td> | ||
| − | <td></td> | + | <td>No source found, parameter is further analyzed in the results section</td> |
</tr> | </tr> | ||
<tr> | <tr> | ||
<td>$k_a$</td> | <td>$k_a$</td> | ||
| − | <td> | + | <td>1</td> |
| − | <td> | + | <td>molecules$^{-1}$min$^{-1}$ (converted)</td> |
<td>Rate of P3 anchoring to virions.</td> | <td>Rate of P3 anchoring to virions.</td> | ||
| − | <td> | + | <td>No source found, parameter is further analyzed in the results section</td> |
</tr> | </tr> | ||
<tr> | <tr> | ||
| Line 334: | Line 316: | ||
<td>min$^{-1}$</td> | <td>min$^{-1}$</td> | ||
<td>Rate at which virions exit the cell.</td> | <td>Rate at which virions exit the cell.</td> | ||
| − | <td></td> | + | <td>No source found, parameter is further analyzed in the results section</td> |
</tr> | </tr> | ||
<tr> | <tr> | ||
| Line 341: | Line 323: | ||
<td>min$^{-1}$</td> | <td>min$^{-1}$</td> | ||
<td>Rate of virion degradation.</td> | <td>Rate of virion degradation.</td> | ||
| − | <td></td> | + | <td>HBV model by Nakabayashi & Sasaki <cite ref="Nakabayashi2011"></cite></td> |
| + | </tr> | ||
| + | <tr> | ||
| + | <td>$L$</td> | ||
| + | <td>0.005</td> | ||
| + | <td>min$^{-1}$</td> | ||
| + | <td>Maximum RNAi effectiveness.</td> | ||
| + | <td>Estimated to be on the order of $\gamma_{35S}$, but slightly larger since RNAi is more effective than degradation</td> | ||
| + | </tr> | ||
| + | <tr> | ||
| + | <td>$k$</td> | ||
| + | <td>10$^{-4}$</td> | ||
| + | <td>molecules$^{-1}$</td> | ||
| + | <td>Slope of logistic function describing RNAi effectiveness</td> | ||
| + | <td>No source found, parameter is further analyzed in the results section.</td> | ||
</tr> | </tr> | ||
</tbody> | </tbody> | ||
</table> | </table> | ||
| + | </div> <!--table-responsive--> | ||
| + | </div> <!-- panel-body--> | ||
| + | </div> | ||
| + | </div> | ||
| + | |||
</section> | </section> | ||
<section id="results" title="Results"> | <section id="results" title="Results"> | ||
<h2>Results</h2> | <h2>Results</h2> | ||
| + | |||
| + | <h3>Time Course of CaMV Infection in a Single Cell</h3> | ||
| + | <p>The effects of RNAi and CRISPR/Cas9 the time course of an infection by CaMV in a single cell were explored.</p> | ||
| − | < | + | <p>Time Series</p> <br> |
| − | < | + | <figure> |
| + | <img src="/wiki/images/7/72/Waterloo_Modeling_CaMV_TimeSeries_a.jpeg" alt="Time series plot" style="width:865px;"/> | ||
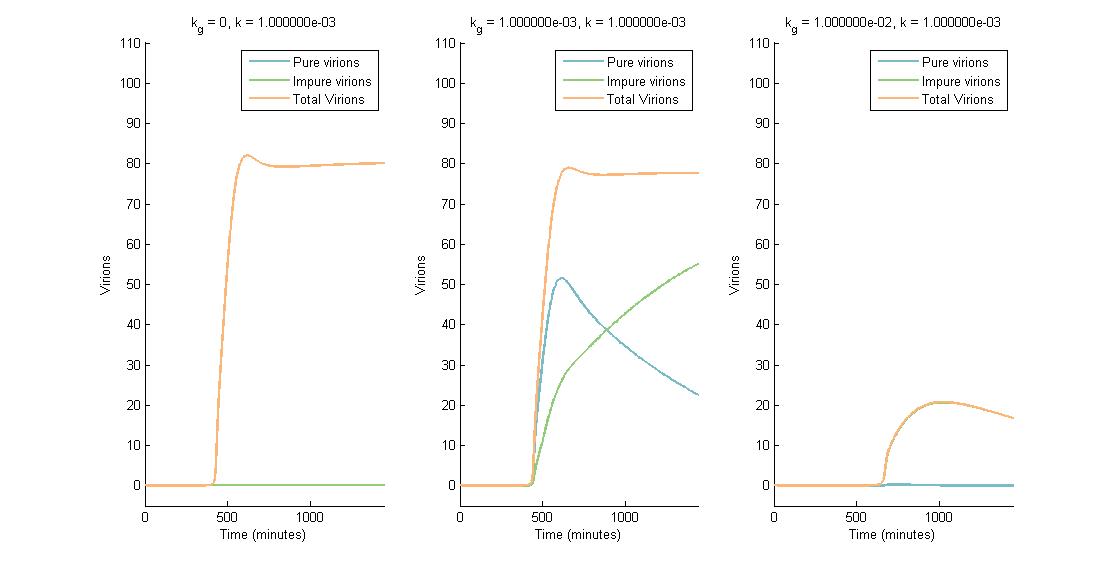
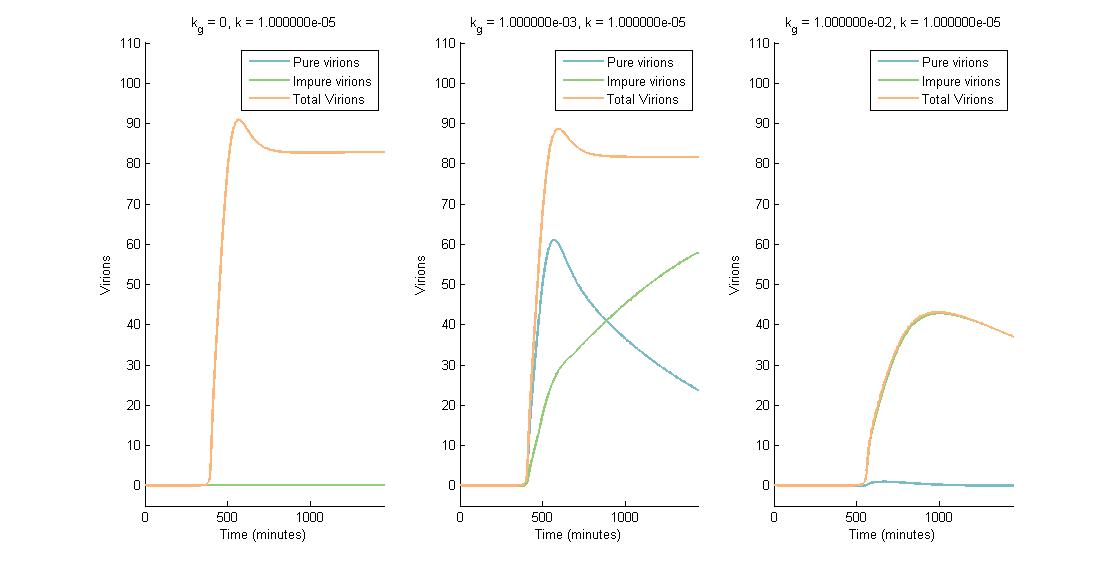
| + | <figcaption>Figure 1 - Time series data of k = $10^{-5}$ and varied genome modification rates </figcaption> | ||
| + | </figure><br> | ||
| − | + | <figure> | |
| + | <img src="/wiki/images/a/a9/Waterloo_Modeling_CaMV_TimeSeries_b.jpeg" alt="Time series plot" style="width:865px;"/> | ||
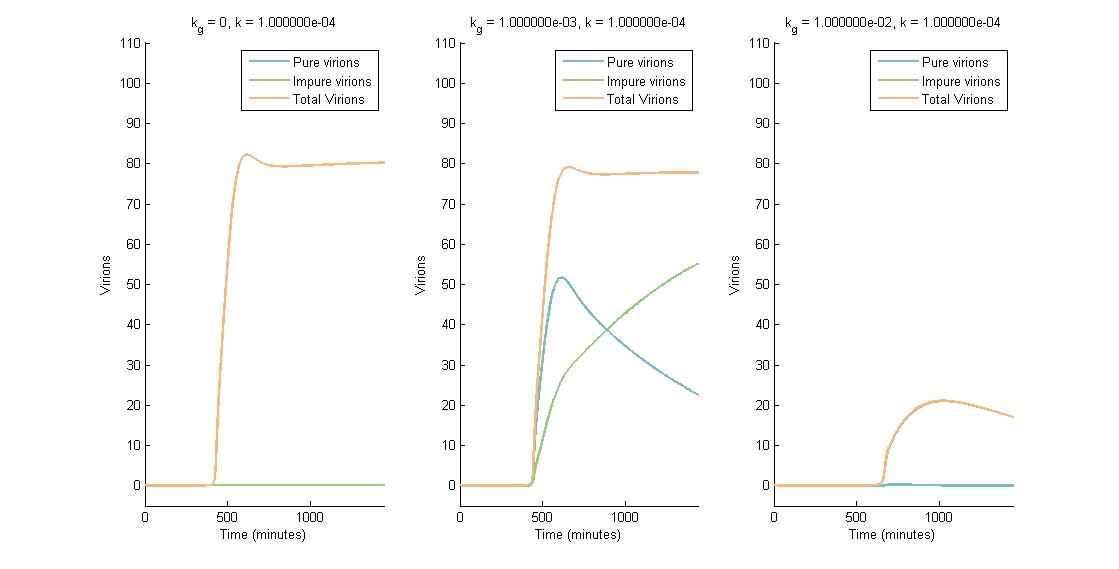
| + | <figcaption>Figure 2 - Time series data of k = $10^{-4}$ and varied genome modification rates </figcaption> | ||
| + | </figure><br> | ||
| + | |||
| + | <figure> | ||
| + | <img src="/wiki/images/7/73/Waterloo_Modeling_CaMV_TimeSeries_c.jpeg" alt="Time series plot" style="width:865px;"/> | ||
| + | <figcaption>Figure 3 - Time series data of k = $10^{-3}$ and varied genome modification rates </figcaption> | ||
| + | </figure><br> | ||
| + | |||
| + | <p>In descending graphs, RNAi effectiveness is increased by a factor of 10. Likewise, shifting to the right increases the CRISPR genome modification rate by a factor of 10. Three observations can be made:</p> | ||
| + | |||
| + | <ol> | ||
| + | <li>When the genome modification rate is 0 $min^{-1}$ (Figure 1A, Figure 2A & Figure 3A), the total virions reach a constant value of ~80-85. Increasing the RNAi effectiveness from $10^{-5}$ to $10^{-4}$ decreases the virion capacity by ~5 virions. </li><br> | ||
| + | |||
| + | <li>When the genome modification rate is 0.001 $min^{-1}$ (Figure 1B, Figure 2B & Figure 3B), the total virions reach the same constant value of ~80-85. However, the total virions encompass both pure virions and impure virions. The pure virions will tend to 0, and the impure virions will reach the ~80-85 constant and then tend to 0. </li><br> | ||
| + | |||
| + | <li>When the genome modification rate is 0.01 $min^{-1}$ (Figure 1C, Figure 2C & Figure 3C), the total virions reach a peak of 20-45 then tend to 0. This is because all genomes produced are converted to impure genomes. Increasing the RNAi effectiveness from $10^{-5}$ to $10^{-4}$ decreases the virion peak by ~20 virions.</li><br> | ||
| + | </ol> | ||
| + | |||
| + | <p>In conclusion, an RNA silencing constant of $10^{-5}$ to $10^{-3}$ $molecules^{-1}$ does not have a meaningful impact on virion concentration. In contrast, increasing the CRISPR modification rate to 0.01 $min^{-1}$ causes the total virion amount to tend to 0.</p> | ||
| + | |||
| + | |||
| + | <h3>Investigating Final Virion Concentration</h3> | ||
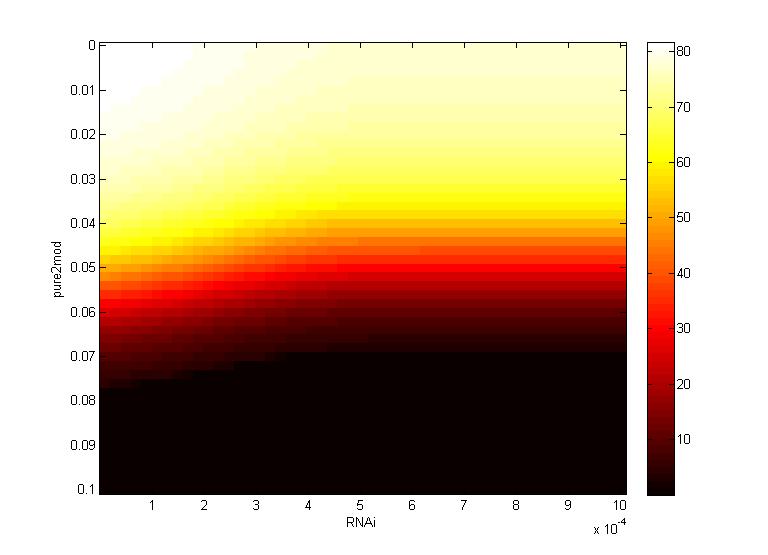
| + | <p>Two inferences can be made from the virion concentration heat maps. The X-axis (RNAi) represents the RNAi effectiveness and the Y-axis (pure2mod) represents the P6 targeted genome modification rate. Furthermore, the virion concentrations were collected over a period of 16 hours. </p> | ||
| + | |||
| + | <figure> | ||
| + | <img src="/wiki/images/6/67/Waterloo_Modeling_CaMV_Heatmap1.jpeg" alt="Heat map" style="width:865px;"/> | ||
| + | <figcaption>Heat map of genome modification and RNAi effectiveness</figcaption> | ||
| + | </figure> | ||
| + | |||
| + | <figure> | ||
| + | <img src="/wiki/images/0/0f/Waterloo_Modeling_CaMV_Heatmap2.jpeg" alt="Heat map" style="width:865px;"/> | ||
| + | <figcaption>Heat map of genome modification and maximum RNAi effectiveness</figcaption> | ||
| + | </figure> | ||
| + | |||
| + | <p>The CRISPR genome modification rate has a greater effect on the final virion concentration than the RNA silencing. This is because the virion concentration gradient changes along genome modification rate axis, not the RNAi axis. </p> | ||
| + | |||
| + | <ul> | ||
| + | <li>For all k values, low virion numbers (0-10) occur when the genome modification rate is high (~0.07 $min^{-1}$). High virion numbers (60-70) occur when the genome modification rate is low (0.04 $min^{-1}$).</li> | ||
| + | </ul> | ||
| + | |||
| + | <p>The CRISPR genome modification rate has a greater effect on the final virion concentration than the maximum RNAi silencing. Again, this is because the virion concentration gradient changes along genome modification rate axis, not the RNA silencing axis.</p> | ||
| + | |||
| + | <ul> | ||
| + | <li>When the maximum RNAi effectiveness is low (< 6 x $10^{-4}$ $min^{-1}$), low virion numbers (0-10) occur when the genome modification rate is high (0.095 $min^{-1}$). High virion numbers (60-70) occur when the genome modification rate is low (0.063 $min^{-1}$). </li> | ||
| + | <li>When the maximum RNAi effectiveness is high (> 6 x $10^{-4}$ $min^{-1}$), both the RNAi and the genome modification affect virion concentration. For example, at a maximum RNAi effectiveness of 10 x $10^{-4}$ $min^{-1}$, a modification rate of only 0.05 $min^{-1}$ is necessary to reduce virion numbers to 0.</li> | ||
| + | </ul> | ||
| + | |||
| + | <p>This serves as another confirmation that using a CRISPR system to reduce viral efficacy is a worthwhile endeavor, as CRISPR genome modification has a more significant impact on virion levels than the primary plant defense, gene silencing. An ideal genome modification rate is ~0.095 $min^{-1}$, as this value is the threshold genome modification rate that decreases the virion numbers to 0 on both heat maps.</p> | ||
| + | |||
| + | <h3>Sensitivity Analysis: Effect of parameter values on steady-state</h3> | ||
| + | <p>Exploration of parameter values is crucial to determining how robust our system is, especially for parameters which we were unable to find values for. Below is a table showing the relative sensitivity of our system to each parameter at the value listed in the parameter table above. Note we omitted $f_u$, $k_p$, $k_a$, $\delta_3$, $\delta_4$, and $\delta_5$ since for each of those parameters the relative sensitivity was less than 0.01. $k_p$ and $k_a$ are two parameters from our parameter table that we were unable to find values for. The fact that the system is insensitive to changes in their values is good, it indicates our system is robust around these parameters. Biologically this is expected since $k_p$ and $k_a$ are mostly limited by the availability of substrates available for packaging and anchoring respectively.</p> | ||
| + | |||
| + | <p>We note that virion concentration at 16 hours is increased the most by increasing the transcription rate of 35S RNA. This is intuitive to us since this leads to more 35S RNA, which means more pregenomes to be packaged and more P3, P4, and P5 available to produce virions. We also see a significant increase from increasing the maximum number of genomes in the nucleus, transcription rates for P3, P4, P5, and P6, and the transcription rate of 19S RNA.</p> | ||
| + | |||
| + | <p>Virion concentration was also very sensitive to $k_g$ and $k_c$, our rates of P6 deactivation by CRISPR/Cas9. An increase in $k_g$ and $k_c$ effectiveness leads to a relatively larger decrease in virion concentrations. This is exciting since our application is focused around the implementation of the CRISPR/Cas9 system. Other parameters that will cause a large relative decrease in virion concentration are the maximum RNAi effectiveness ($L$) and the half-saturation constant for P6 activation.</p> | ||
| + | |||
| + | <h4>Relative Sensitivity at 16 hours</h4> | ||
| + | <table class="table table-condensed"> | ||
| + | <thead> | ||
| + | <tr> | ||
| + | <th>Parameter</th> | ||
| + | <th>Relative Sensitivity</th> | ||
| + | </tr> | ||
| + | </thead> | ||
| + | <tbody> | ||
| + | <tr> | ||
| + | <td>$\alpha_{35}$</td> | ||
| + | <td>$1.48$</td> | ||
| + | </tr> | ||
| + | <tr> | ||
| + | <td>$d_{max}$</td> | ||
| + | <td>$1.26$</td> | ||
| + | </tr> | ||
| + | <tr> | ||
| + | <td>$\beta_3, \beta_4, \beta_5, \beta_6$</td> | ||
| + | <td>$1.06$</td> | ||
| + | </tr> | ||
| + | <tr> | ||
| + | <td>$\beta_6$</td> | ||
| + | <td>$1.03$</td> | ||
| + | </tr> | ||
| + | <tr> | ||
| + | <td>$\alpha_{19}$</td> | ||
| + | <td>$1.03$</td> | ||
| + | </tr> | ||
| + | <tr> | ||
| + | <td>$\alpha_c$</td> | ||
| + | <td>$0.20$</td> | ||
| + | </tr> | ||
| + | <tr> | ||
| + | <td>$k_v$</td> | ||
| + | <td>$0.01$</td> | ||
| + | </tr> | ||
| + | <tr> | ||
| + | <td>$...$</td> | ||
| + | <td>$...$</td> | ||
| + | </tr> | ||
| + | <tr> | ||
| + | <td>$\delta_v$</td> | ||
| + | <td>$-0.01$</td> | ||
| + | </tr> | ||
| + | <tr> | ||
| + | <td>$k$</td> | ||
| + | <td>$-0.05$</td> | ||
| + | </tr> | ||
| + | <tr> | ||
| + | <td>$\gamma_d$</td> | ||
| + | <td>$-0.09$</td> | ||
| + | </tr> | ||
| + | <tr> | ||
| + | <td>$\gamma_{19}$</td> | ||
| + | <td>$-0.14$</td> | ||
| + | </tr> | ||
| + | <tr> | ||
| + | <td>$\gamma_{35}$</td> | ||
| + | <td>$-0.18$</td> | ||
| + | </tr> | ||
| + | <tr> | ||
| + | <td>$\delta_6$</td> | ||
| + | <td>$-0.34$</td> | ||
| + | </tr> | ||
| + | <tr> | ||
| + | <td>$v_e$</td> | ||
| + | <td>$-0.99$</td> | ||
| + | </tr> | ||
| + | <tr> | ||
| + | <td>$K_6$</td> | ||
| + | <td>$-1.03$</td> | ||
| + | </tr> | ||
| + | <tr> | ||
| + | <td>$L$</td> | ||
| + | <td>$-1.55$</td> | ||
| + | </tr> | ||
| + | <tr> | ||
| + | <td>$k_g, k_c$</td> | ||
| + | <td>$-1.74$</td> | ||
| + | </tr> | ||
| + | </tbody> | ||
| + | </table> | ||
| + | |||
| + | <h3>Phase Plane Analysis: Effect of initial conditions on steady state</h3> | ||
| + | |||
| + | <p>We want to investigate how the total and relative concentrations of wild-type or $\Delta$-P6 virions will vary over time using different founder population compositions and varying the P6-deactivation rate. To investigate this we produced phase plane diagrams comparing the amount of wild-type virions in the cell against the amount of modified ones.</p> | ||
| + | |||
| + | <p>Below are three sections, each with a different $k_g$ and $k_c$, which show how the composition of virions in the cell will change over time with or without our CRISPR/Cas9 system. In each case, the lines are colour-coded by the initial concentration of virions. If the founder population is mostly wild-type the curve is dark blue, if founders are mostly mutants the curve will be green, and mixed populations will have a colour in between. Founder populations are varied from 0 to 10 genomes for each of the trajectories.</p> | ||
| + | |||
| + | <p>This analysis fits nicely with our viral spread model, as it will tell us how initial composition of founders will affect viral load. It also fits nicely with the CRISPR/Cas9 analysis as it shows how behaviour changes given different values for $k_g$ or $k_c$.</p> | ||
| + | |||
| + | <p><b>Note:</b> In each plot below “pure virions” refers to the number of virions in the cell which contain the wild-type genome while “impure virions” refers to the number of virions containing the genome without functional P6.</p> | ||
| + | |||
| + | <h4>Phase plane with no P6 deactivation $k_g = k_c = 0$</h4> | ||
| + | <p>As shown in the four graphs below, phase planes with no P6-deactivation are not particularly interesting. Since there's no conversion from wild-type to modified genomes the lines are perfectly straight. Their slope is determined by the initial composition of wild-type and modified genomes while the final position after a given time are determined by the initial wild-type genomes (since only wild-type genomes produce P6).</p> | ||
| + | |||
| + | <p>After 4 hours there are no virions present in the cell which corresponds to the lag between initial infection and virion production. After 6 hours the cell begins to produce virions at fairly low concentrations. At 8 hours the cell produces slightly more. Finally, by 16 hours the number of virions has reached steady state, which is indicated by the regular line length. The lines do decrease in length as the slope increases since lines with a larger slope have more modified genomes which leads to less P6 and thus fewer total virions at steady state.</p> | ||
| + | |||
| + | <figure> | ||
| + | <img src="/wiki/images/d/d6/Waterloo_Modeling_CaMV_PP_0_1.jpeg" alt="Phase plane diagram" style="width:865px;"/> | ||
| + | <!-- <figcaption>Phase diagram with $k_g$ = 0</figcaption> --> | ||
| + | </figure> | ||
| + | |||
| + | <figure> | ||
| + | <img src="/wiki/images/0/0e/Waterloo_Modeling_CaMV_PP_0_2.jpeg" alt="Phase plane diagram" style="width:865px;"/> | ||
| + | <figcaption>Phase diagram with $k_g$ = 0</figcaption> | ||
| + | </figure> | ||
| + | |||
| + | <h4>Phase plane with no P6 deactivation $k_g = k_c = 0.001$</h4> | ||
| + | <p>Much more interesting is when P6-deactivation is non-zero. At 6 hours there is a low amount of virions produced in the cell. At 16 hours we see most virion trajectories have reached steady state (seen in the graph by the top right limit), but these curves have another interesting property. Due to the conversion of wild-type virions the lines are curving upwards as there are more mutated genomes to produce them.</p> | ||
| + | |||
| + | <p>However, over time (seen clearly at about 48 hours) the total amount of virions curves back on itself. This is due to having all genomes having P6 deactivated and thus no transactivation from P6 to produce P3, P4, and P5. Once P6 has started degrading the concentrations of the other proteins decrease and so the total viral load lowers. After 80 hours we see that the total amount of virions will drop down to zero.</p> | ||
| + | |||
| + | <figure> | ||
| + | <img src="/wiki/images/f/fd/Waterloo_Modeling_CaMV_PP_1_1.jpeg" alt="Phase plane diagram" style="width:865px;"/> | ||
| + | <!-- <figcaption>Phase diagram with $k_g$ = 0.001</figcaption> --> | ||
| + | </figure> | ||
| + | |||
| + | <figure> | ||
| + | <img src="/wiki/images/5/52/Waterloo_Modeling_CaMV_PP_1_2.jpeg" alt="Phase plane diagram" style="width:865px;"/> | ||
| + | <figcaption>Phase diagram with $k_g$ = 0.001</figcaption> | ||
| + | </figure> | ||
| + | |||
| + | <h4>Phase plane with high P6 deactivation $k_g = k_c = 0.01$</h4> | ||
| + | <p>Here we see what happens when the P6-deactivation rate is high. Again, at 4 hours there are no virions present. At 8 hours there are virions present and again all the lines curve upwards due to the conversion of wild-type genomes to modified versions. Note also the “feathery” pattens in the trajectories at 8 hours which are caused by the fact that we varied both wild-type and modified genomes from 0 to 10.</p> | ||
| + | |||
| + | <p>At 16 hours we see that with this high P6 deactivation rate the virions start to curve inwards much earlier than they did in the previous section. Finally, at 24 hours the viral load is in sharp decline due to the total lack of P6 in the cell.</p> | ||
| + | |||
| + | <figure> | ||
| + | <img src="/wiki/images/0/03/Waterloo_Modeling_CaMV_PP_2_1.jpeg" alt="Phase plane diagram" style="width:865px;"/> | ||
| + | <!-- <figcaption>Phase diagram with $k_g$ = 0.01</figcaption> --> | ||
| + | </figure> | ||
| + | |||
| + | <figure> | ||
| + | <img src="/wiki/images/a/a9/Waterloo_Modeling_CaMV_PP_2_2.jpeg" alt="Phase plane diagram" style="width:865px;"/> | ||
| + | <figcaption>Phase diagram with $k_g$ = 0.01</figcaption> | ||
| + | </figure> | ||
| − | |||
| − | |||
</section> | </section> | ||
| + | |||
<section id="references" title="References"> | <section id="references" title="References"> | ||
| Line 363: | Line 564: | ||
<ol id="reflist"></ol> | <ol id="reflist"></ol> | ||
</section> | </section> | ||
| − | |||
</div> | </div> | ||
</html> | </html> | ||
{{Waterloo_Footer}} | {{Waterloo_Footer}} | ||
Latest revision as of 03:53, 19 September 2015
CaMV Replication

This leads to our second goal which is to integrate the intracellular replication and intercellular spread models to fully understand impact of CRISPR/Cas9. Altogether, we are attempting to demonstrate the feasibility of our anti-viral system and use our findings to direct the project design.
Model Formation
There are several core processes involved in CaMV replication within an infected host cell. The details of CaMV replication are discussed on the CaMV Biology page and shown in the figure. In brief, however, we determined that in addition to typical processes such as transcription, constitutive translation, and degradation we must also account for the following processes in our model:
- Virions reinfecting the nucleus
- Repair of pdsDNA
- Splicing of 35S RNA
- RNA interference
- Packaging of 35S RNA
- P6 transactivating production of P1-P5
- Anchoring of P3 to the viral capsid
- Virions exiting the cell
Additionally, since our project uses CRISPR to produce a targeted mutation in the P6 gene, we track both wild-type and mutated versions of genomes, pregenomes, and virions.
- Photo © Haas et al. (2005)
- Figure 3 of Cauliflower mosaic virus: still in the news
Network and Equations
The replication pathway of CaMV, simplified to contain only the processes of interest, is shown in the figure below. Gapped CaMV genomes ($g_{gap}$) are closed ($g_{cc}$) and modified by CRISPR/Cas9 ($g_{m.gap}$, $g_{m.cc}$). The modified genomes produce 35S transcripts $35S_m$, but do not produce P6, which is needed to activate translation of the $35S$ transcript into $P3$, $P4$ and $P5$. Proteins $P1$ and $P2$ are disregarded because they mostly play a role in aphid transmission, which we did not model.
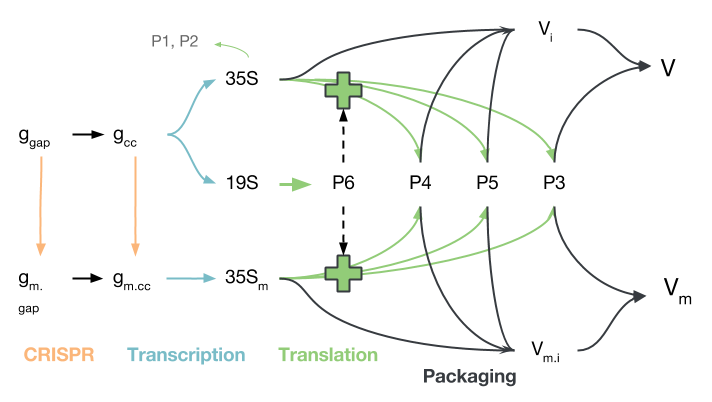
The proteins produced from either 35S transcript ($35S$ or $35S_m$) may be used to package virions, though virions produced from $35S_m$, while they are packaged and transported to other cells, will not be able to initiate infection due to their deactivated P6 gene. It should be noted that transport in and out of the nucleus is not modelled explicitly, though certain species only reside in the nucleus and others only in the cytoplasm.
The principles of mass-action kinetics, reviewed by Ingalls , were used to extract a series of ordinary differential equations from this network. The construction of the network and extraction of equations required a number of assumptions, which are detailed below.
State Variables
- $d_g$: Gapped DNA in nucleus
- $d_{cc}$: cccDNA in nucleus
- $d_{m.g}$: Modified gapped DNA in nucleus
- $d_{m.cc}$: Modified cccDNA in nucleus
- $r_{19S}$: 19S RNA
- $r_{35S}$: 35S RNA
- $r_{35Sm}$: Modified 35S RNA
- $P_3$: Protein 3
- $P_4$: Protein 4
- $P_5$: Protein 5
- $P_6$: Protein 6
- $V_i$: Intermediate virions
- $V_{im}$: Intermediate virions with modified genome
- $V_m$: Modified virions
- $V$: Virions
CaMV DNA
CaMV DNA is present in both gapped and ungapped forms in the nucleus and may be converted to "modified" form by CRISPR/Cas9, which removes its P6 activity. There is assumed to be a carrying capacity for viruses within the nucleus because of limited cellular resources and the nucleus may be reinfected by virions packaged in the cytoplasm.
$$\frac{d d_g}{dt} = k_v V (d_{max} - d_{total}) - \alpha_c d_g - k_g d_g - \gamma_d d_g$$ $$\frac{d d_{cc}}{dt} = \alpha_c d_g - k_c d_{cc} - \gamma_d d_{cc}$$ $$\frac{d d_{m.g}}{dt} = k_v V_m (d_{max} - d_{total}) - \alpha_c d_{m.g} + k_g d_g - \gamma_d d_{m.g}$$ $$\frac{d d_{m.cc}}{dt} = \alpha_c d_{m.g} + k_c d_{cc} - \gamma_d d_{m.cc}$$
RNA
We consider three transcripts, all assumed to be of importance only in the cytoplasm. The 19S mRNA transcript, the 35S transcript and the modified 35S transcript. These transcripts are degraded both passively, according to the $\gamma_{19S}$ and $\gamma_{35S}$ parameters, and actively by the plant RNAi defenses, captured in the $\gamma_{r}$ term. The 35S transcripts are also packaged into virions by a P4/P5 complex present on the inclusion bodies.
$$\frac{d r_{19S}}{dt} = \alpha_{19S} d_{cc} - (\gamma_{19S}+\gamma_{r}) r_{19S}$$ $$\frac{d r_{35S}}{dt} = \alpha_{35S} d_{cc} - k_p p_4 p_5 f_u r_{35S} - (\gamma_{35S}+\gamma_{r}) r_{35S}$$ $$\frac{d r_{35Sm}}{dt} = \alpha_{35S} d_{m.cc} - k_p p_4 p_5 f_u r_{35Sm} - (\gamma_{35S}+\gamma_{r}) r_{35Sm}$$
Protein
The concentrations of four proteins are modelled. Translation of P3, P4 and P5 from the either of the 35S transcripts occurs because of activation by P6, while P6 is translated from the 19S transcript. All transcripts proteins are degraded and P3, P4 and P5 participate in viral packaging.
$$\frac{d p_3}{dt} = \beta_3 \left( \frac{p_6}{p_6+K_6} \right) (r_{35S} + r_{35Sm}) - k_a p_3 (V_i+V_{im}) - \delta_3 p_3$$ $$\frac{d p_4}{dt} = \beta_4 \left( \frac{p_6}{p_6+K_6} \right) (r_{35S} + r_{35Sm}) - k_p p_4 p_5 f_u (r_{35S} + r_{35Sm}) - \delta_4 p_4$$ $$\frac{d p_5}{dt} = \beta_5 \left( \frac{p_6}{p_6+K_6} \right) (r_{35S} + r_{35Sm}) - k_p p_4 p_5 f_u (r_{35S} + r_{35Sm}) - \delta_5 p_5$$ $$\frac{d p_6}{dt} = \beta_6 r_{19S} - \delta_6 p_6$$
Virions
The concentrations of four proteins are modelled. Translation of P3, P4 and P5 from the either of the 35S transcripts occurs because of activation by P6, while P6 is translated from the 19S transcript. All transcripts proteins are degraded and P3, P4 and P5 participate in viral packaging. Due to the complicated nature and relative lack of characterization of viral packaging, we decided in our model to combine the packaging reaction into one term, dependent on P4, P5, and unspliced 35S RNA concentration.
$$\frac{d V_i}{dt} = k_p p_4 p_5 f_u r_{35S} - k_a p_3 V_i$$ $$\frac{d V}{dt} = k_a p_3 V_i - k_v V (d_{max} - d_{total}) - v_e V - \delta_v V$$ $$\frac{d V_{im}}{dt} = k_p p_4 p_5 f_u r_{35Sm} - k_a p_3 V_{im}$$ $$\frac{d V_m}{dt} = k_a p_3 V_{im} - k_v V_m (d_{max} - d_{total}) - v_e V_m - \delta_v V_m$$
Algebraic Equations
Not all equations pertinent to the dynamics are differential: in particular, the carrying capacity of genomes in the nucleus and effect of RNAi are modelled using algebraic equations.
$$d_{total} = d_g + d_{cc} + d_{m.g} + d_{m.cc}$$ $$\gamma_r = \frac{L}{1+e^{k (p_6-x_0)}}$$ $$x_0 = \frac{1}{2} p_6 ^{ss}$$ $$p_6 ^{ss} = \frac{\beta_6}{\delta_6} \frac{\alpha_{19}}{\gamma_{19}} d_{max}$$
- Cell concentrations are continuous
- Molecules in the cytosplasm are well-mixed
- No outside infection
- This ODE model only tracks replication within one cell, it cannot track multiple cells. This is handled by the viral spread model instead
- Limited number of genomes in nucleus
- "Another pool of viral genomes, in the order of 10-100 copies of minichromosomes comprising supercoiled circular viral DNA and host histones, accumulates in the nucleus."
- Rate of repair of gapped DNA follows law of mass-action
- Rate of P6 gene mutation is proportional to number of wild-type genomes
- DNA, RNA, proteins, and complete virions degrade, incomplete virions do not
- We assume P3 binds to virions rapidly enough for incomplete virion degradation to be negligible
- We are only targeting 19S RNA
- RNA production follows mass-action
- Concentration of spliced/unspliced RNA is at rapid equilibrium
- Spliced and unspliced 35S RNA degrade at the same rate
- Encapsidation and reverse transcription occur simultaneously
- Information for CaMV is lacking, but for HBV (another pararetrovirus) reverse transcription is initiated during encapsidation and encapsidation is initiated by RT . The complexity of this packaging process is not fully captured in this model
- Only unspliced RNA is packaged
- Spliced RNA lacks P1 and P2 and so, although able to replicate within the cell, virions which package spliced RNA will be unable to propagate
- P1 and P2 do not affect replication dynamics
- P1 is primarily involved in cell-to-cell movement and P2 with host-to-host movement. Neither have a significant impact on the replication process
- P6 is only translated from 19S RNA, translation rate is proportional to cccDNA copy number
- P3, P4, and P5 are translated from 35S RNA, translation is activated by P6
- This is very well established
- All P6 is incorporated in inclusion bodies
- Mass-action anchoring of P3 to virions
- All P4 is instantaneously spliced
- As discussed above the subtleties of encapsidation are not captured by this model
- Virions may reinfect nucleus
- This is very well established
- Virions leave the cell at a constant rate
Model Parameters
Finding and implementing accurate parameter values is crucial when trying to draw conclusions from a model. Our model contains nearly thirty parameters, each of which needed to be found to exactly reproduce the viral replication process in silico. Model dynamics may be drastically affected by our choice in parameters and this must be accounted for in our analysis. However, as with many models in systems biology our network suffers from the "parameter problem" described in chapter 1 of the book by Gunawardena which arises from the complexity of biological processes and the difficulty in measuring parameter values.
A number of parameter values are the same as those used in an HBV model developed by Nakabayashi & Sasaki . Parameters that have a reference in the "Source" column are ones we were able to find or derive accurate values for from the literature. Unfortunately, there are a few parameter values that could not be found (e.g. the half-saturation constant of P6 activation) and so we explicitly mention the absence of data in the table. In order to compensate for the lack of accurate parameters, we analyze our model over a wide range of parameters to determine how behaviour will be affected.
Lastly, for simplicity we normalized each concentration by the volume of the cell (volume=1.414x10$^{-13}$m$^3$).
| Symbol | Value | Units | Description | Source |
|---|---|---|---|---|
| $k_v$ | 0.1 | min$^{-1}$ | Rate at which virions produced by the cell reinfect the nucleus. | No source found, parameter is further analyzed in the results section |
| $d_{max}$ | 100 | molecules/volume | Maximum concentration of viral genomes in the nucleus. | "Another pool of viral genomes, in the order of 10-100 copies of minichromosomes comprising supercoiled circular viral DNA and host histones, accumulates in the nucleus" |
| $\alpha_c$ | 0.1 | min$^{-1}$ | Rate at which gaps are repaired in gapped DNA to form cccDNA. | HBV model by Nakabayashi & Sasaki |
| $k_g$ | 0.01 | min$^{-1}$ | Rate at which the P6 gene on the gapped DNA is modified. | No source found, parameter is further analyzed in the results section |
| $k_c$ | 0.01 | min$^{-1}$ | Rate at which the P6 gene on cccDNA is modified. | No source found, parameter is further analyzed in the results section |
| $\gamma_d$ | 0.001 | min$^{-1}$ | DNA Degradation rate. | HBV model by Nakabayashi & Sasaki |
| $\alpha_{19S}$ | 0.01 | min$^{-1}$ | Transcription rate of 19S RNA. | HBV model by Nakabayashi & Sasaki |
| $\alpha_{35S}$ | 0.09 | min$^{-1}$ | Transcription rate of 35S RNA. | HBV model by Nakabayashi & Sasaki |
| $\gamma_{19S}$, $\gamma_{35S}$ | 0.001 | min$^{-1}$ | Degradation rate of 19S RNA, 35S RNA. | HBV model by Nakabayashi & Sasaki |
| $f_u$ | 0.3 | unitless | Fraction of unspliced 35S RNA in the cell (assumed at equilibrium). | Froissart et al. 2004 <\cite> and Bouton et al. 2015 <\cite> |
| $\beta_3$, $\beta_4$, $\beta_5$, $\beta_6$ | 0.1 | min$^{-1}$ | Translation rate of P3, P4, P5, P6. | HBV model by Nakabayashi & Sasaki |
| $K_6$ | 5000 | molecules/volume | Half-saturation constant for transactivation of P1-P5 production. | No source found, parameter is further analyzed in the results section |
| $\delta_3$, $\delta_4$, $\delta_5$, $\delta_6$ | 0.001 | min$^{-1}$ | Degradation rate of P3, P4, P5, P6. | HBV model by Nakabayashi & Sasaki |
| $k_p$ | 0.1 | molecules$^{-2}$ min$^{-1}$ | Packaging rate. | No source found, parameter is further analyzed in the results section |
| $k_a$ | 1 | molecules$^{-1}$min$^{-1}$ (converted) | Rate of P3 anchoring to virions. | No source found, parameter is further analyzed in the results section |
| $v_e$ | 0.1 | min$^{-1}$ | Rate at which virions exit the cell. | No source found, parameter is further analyzed in the results section |
| $\delta_v$ | 0.001 | min$^{-1}$ | Rate of virion degradation. | HBV model by Nakabayashi & Sasaki |
| $L$ | 0.005 | min$^{-1}$ | Maximum RNAi effectiveness. | Estimated to be on the order of $\gamma_{35S}$, but slightly larger since RNAi is more effective than degradation |
| $k$ | 10$^{-4}$ | molecules$^{-1}$ | Slope of logistic function describing RNAi effectiveness | No source found, parameter is further analyzed in the results section. |
Results
Time Course of CaMV Infection in a Single Cell
The effects of RNAi and CRISPR/Cas9 the time course of an infection by CaMV in a single cell were explored.
Time Series
In descending graphs, RNAi effectiveness is increased by a factor of 10. Likewise, shifting to the right increases the CRISPR genome modification rate by a factor of 10. Three observations can be made:
- When the genome modification rate is 0 $min^{-1}$ (Figure 1A, Figure 2A & Figure 3A), the total virions reach a constant value of ~80-85. Increasing the RNAi effectiveness from $10^{-5}$ to $10^{-4}$ decreases the virion capacity by ~5 virions.
- When the genome modification rate is 0.001 $min^{-1}$ (Figure 1B, Figure 2B & Figure 3B), the total virions reach the same constant value of ~80-85. However, the total virions encompass both pure virions and impure virions. The pure virions will tend to 0, and the impure virions will reach the ~80-85 constant and then tend to 0.
- When the genome modification rate is 0.01 $min^{-1}$ (Figure 1C, Figure 2C & Figure 3C), the total virions reach a peak of 20-45 then tend to 0. This is because all genomes produced are converted to impure genomes. Increasing the RNAi effectiveness from $10^{-5}$ to $10^{-4}$ decreases the virion peak by ~20 virions.
In conclusion, an RNA silencing constant of $10^{-5}$ to $10^{-3}$ $molecules^{-1}$ does not have a meaningful impact on virion concentration. In contrast, increasing the CRISPR modification rate to 0.01 $min^{-1}$ causes the total virion amount to tend to 0.
Investigating Final Virion Concentration
Two inferences can be made from the virion concentration heat maps. The X-axis (RNAi) represents the RNAi effectiveness and the Y-axis (pure2mod) represents the P6 targeted genome modification rate. Furthermore, the virion concentrations were collected over a period of 16 hours.
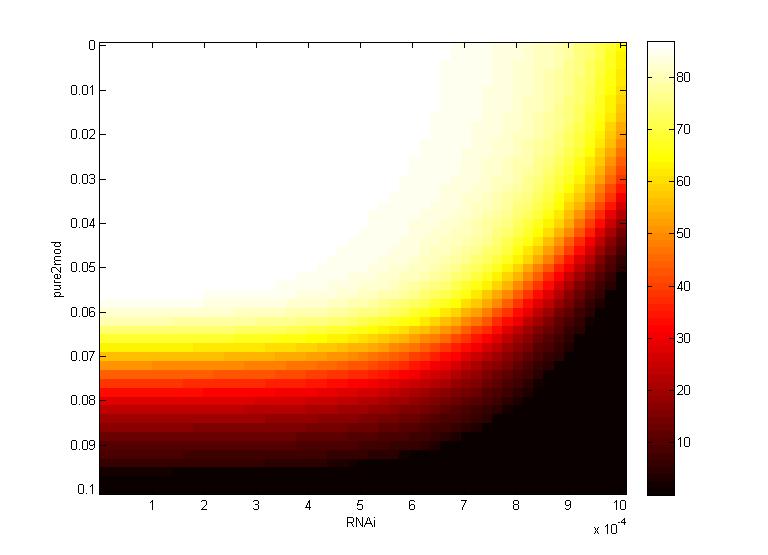
The CRISPR genome modification rate has a greater effect on the final virion concentration than the RNA silencing. This is because the virion concentration gradient changes along genome modification rate axis, not the RNAi axis.
- For all k values, low virion numbers (0-10) occur when the genome modification rate is high (~0.07 $min^{-1}$). High virion numbers (60-70) occur when the genome modification rate is low (0.04 $min^{-1}$).
The CRISPR genome modification rate has a greater effect on the final virion concentration than the maximum RNAi silencing. Again, this is because the virion concentration gradient changes along genome modification rate axis, not the RNA silencing axis.
- When the maximum RNAi effectiveness is low (< 6 x $10^{-4}$ $min^{-1}$), low virion numbers (0-10) occur when the genome modification rate is high (0.095 $min^{-1}$). High virion numbers (60-70) occur when the genome modification rate is low (0.063 $min^{-1}$).
- When the maximum RNAi effectiveness is high (> 6 x $10^{-4}$ $min^{-1}$), both the RNAi and the genome modification affect virion concentration. For example, at a maximum RNAi effectiveness of 10 x $10^{-4}$ $min^{-1}$, a modification rate of only 0.05 $min^{-1}$ is necessary to reduce virion numbers to 0.
This serves as another confirmation that using a CRISPR system to reduce viral efficacy is a worthwhile endeavor, as CRISPR genome modification has a more significant impact on virion levels than the primary plant defense, gene silencing. An ideal genome modification rate is ~0.095 $min^{-1}$, as this value is the threshold genome modification rate that decreases the virion numbers to 0 on both heat maps.
Sensitivity Analysis: Effect of parameter values on steady-state
Exploration of parameter values is crucial to determining how robust our system is, especially for parameters which we were unable to find values for. Below is a table showing the relative sensitivity of our system to each parameter at the value listed in the parameter table above. Note we omitted $f_u$, $k_p$, $k_a$, $\delta_3$, $\delta_4$, and $\delta_5$ since for each of those parameters the relative sensitivity was less than 0.01. $k_p$ and $k_a$ are two parameters from our parameter table that we were unable to find values for. The fact that the system is insensitive to changes in their values is good, it indicates our system is robust around these parameters. Biologically this is expected since $k_p$ and $k_a$ are mostly limited by the availability of substrates available for packaging and anchoring respectively.
We note that virion concentration at 16 hours is increased the most by increasing the transcription rate of 35S RNA. This is intuitive to us since this leads to more 35S RNA, which means more pregenomes to be packaged and more P3, P4, and P5 available to produce virions. We also see a significant increase from increasing the maximum number of genomes in the nucleus, transcription rates for P3, P4, P5, and P6, and the transcription rate of 19S RNA.
Virion concentration was also very sensitive to $k_g$ and $k_c$, our rates of P6 deactivation by CRISPR/Cas9. An increase in $k_g$ and $k_c$ effectiveness leads to a relatively larger decrease in virion concentrations. This is exciting since our application is focused around the implementation of the CRISPR/Cas9 system. Other parameters that will cause a large relative decrease in virion concentration are the maximum RNAi effectiveness ($L$) and the half-saturation constant for P6 activation.
Relative Sensitivity at 16 hours
| Parameter | Relative Sensitivity |
|---|---|
| $\alpha_{35}$ | $1.48$ |
| $d_{max}$ | $1.26$ |
| $\beta_3, \beta_4, \beta_5, \beta_6$ | $1.06$ |
| $\beta_6$ | $1.03$ |
| $\alpha_{19}$ | $1.03$ |
| $\alpha_c$ | $0.20$ |
| $k_v$ | $0.01$ |
| $...$ | $...$ |
| $\delta_v$ | $-0.01$ |
| $k$ | $-0.05$ |
| $\gamma_d$ | $-0.09$ |
| $\gamma_{19}$ | $-0.14$ |
| $\gamma_{35}$ | $-0.18$ |
| $\delta_6$ | $-0.34$ |
| $v_e$ | $-0.99$ |
| $K_6$ | $-1.03$ |
| $L$ | $-1.55$ |
| $k_g, k_c$ | $-1.74$ |
Phase Plane Analysis: Effect of initial conditions on steady state
We want to investigate how the total and relative concentrations of wild-type or $\Delta$-P6 virions will vary over time using different founder population compositions and varying the P6-deactivation rate. To investigate this we produced phase plane diagrams comparing the amount of wild-type virions in the cell against the amount of modified ones.
Below are three sections, each with a different $k_g$ and $k_c$, which show how the composition of virions in the cell will change over time with or without our CRISPR/Cas9 system. In each case, the lines are colour-coded by the initial concentration of virions. If the founder population is mostly wild-type the curve is dark blue, if founders are mostly mutants the curve will be green, and mixed populations will have a colour in between. Founder populations are varied from 0 to 10 genomes for each of the trajectories.
This analysis fits nicely with our viral spread model, as it will tell us how initial composition of founders will affect viral load. It also fits nicely with the CRISPR/Cas9 analysis as it shows how behaviour changes given different values for $k_g$ or $k_c$.
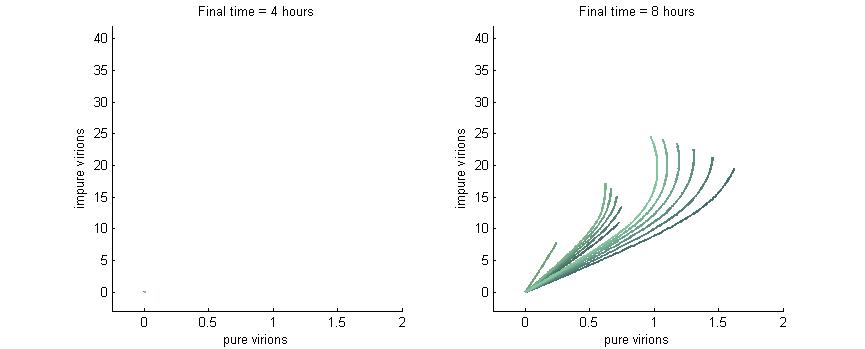
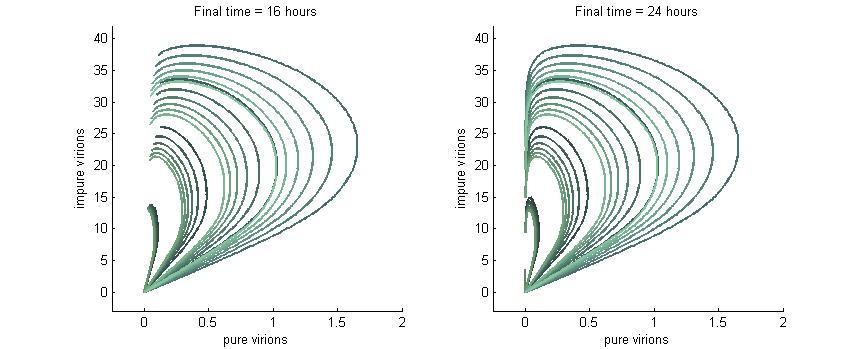
Note: In each plot below “pure virions” refers to the number of virions in the cell which contain the wild-type genome while “impure virions” refers to the number of virions containing the genome without functional P6.
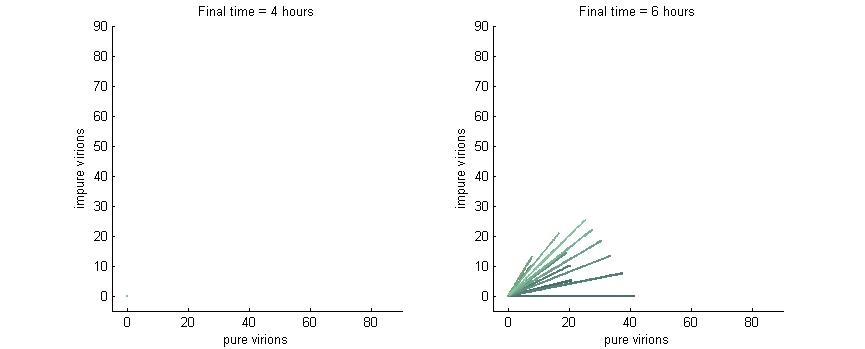
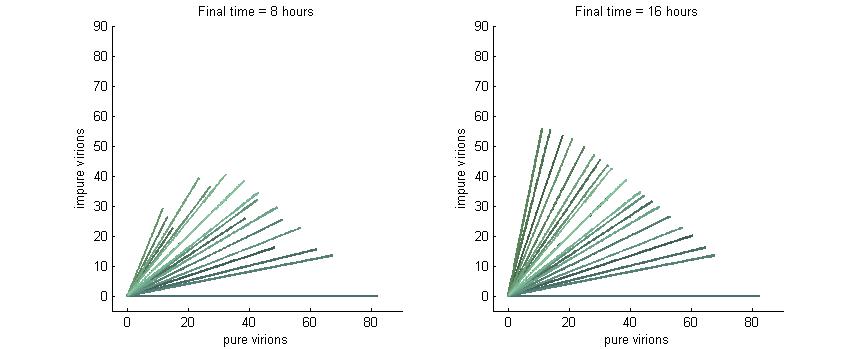
Phase plane with no P6 deactivation $k_g = k_c = 0$
As shown in the four graphs below, phase planes with no P6-deactivation are not particularly interesting. Since there's no conversion from wild-type to modified genomes the lines are perfectly straight. Their slope is determined by the initial composition of wild-type and modified genomes while the final position after a given time are determined by the initial wild-type genomes (since only wild-type genomes produce P6).
After 4 hours there are no virions present in the cell which corresponds to the lag between initial infection and virion production. After 6 hours the cell begins to produce virions at fairly low concentrations. At 8 hours the cell produces slightly more. Finally, by 16 hours the number of virions has reached steady state, which is indicated by the regular line length. The lines do decrease in length as the slope increases since lines with a larger slope have more modified genomes which leads to less P6 and thus fewer total virions at steady state.
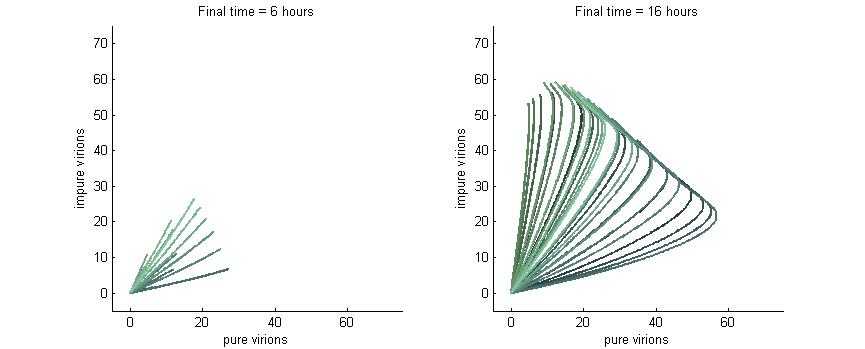
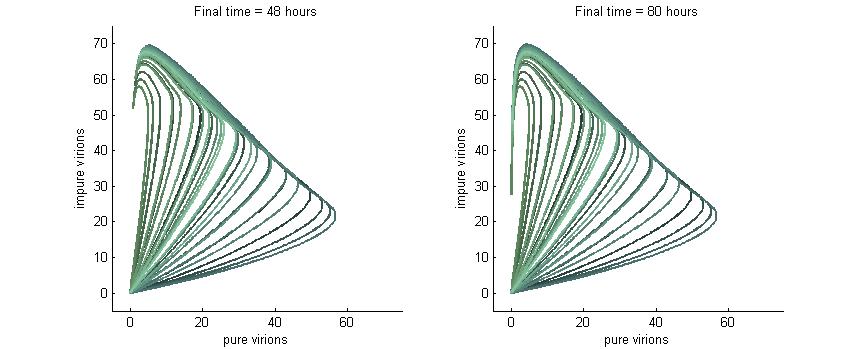
Phase plane with no P6 deactivation $k_g = k_c = 0.001$
Much more interesting is when P6-deactivation is non-zero. At 6 hours there is a low amount of virions produced in the cell. At 16 hours we see most virion trajectories have reached steady state (seen in the graph by the top right limit), but these curves have another interesting property. Due to the conversion of wild-type virions the lines are curving upwards as there are more mutated genomes to produce them.
However, over time (seen clearly at about 48 hours) the total amount of virions curves back on itself. This is due to having all genomes having P6 deactivated and thus no transactivation from P6 to produce P3, P4, and P5. Once P6 has started degrading the concentrations of the other proteins decrease and so the total viral load lowers. After 80 hours we see that the total amount of virions will drop down to zero.
Phase plane with high P6 deactivation $k_g = k_c = 0.01$
Here we see what happens when the P6-deactivation rate is high. Again, at 4 hours there are no virions present. At 8 hours there are virions present and again all the lines curve upwards due to the conversion of wild-type genomes to modified versions. Note also the “feathery” pattens in the trajectories at 8 hours which are caused by the fact that we varied both wild-type and modified genomes from 0 to 10.
At 16 hours we see that with this high P6 deactivation rate the virions start to curve inwards much earlier than they did in the previous section. Finally, at 24 hours the viral load is in sharp decline due to the total lack of P6 in the cell.