Difference between revisions of "Team:Waterloo/Results"
(add cas9 section) |
|||
| Line 20: | Line 20: | ||
</figure> | </figure> | ||
<p> | <p> | ||
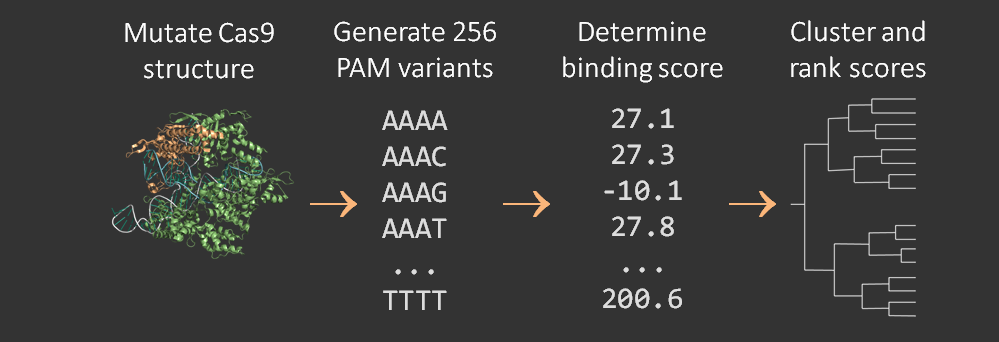
| − | A pipeline | + | A software pipeline was developed to determine the PAM-binding selectivity of variant Cas9 proteins. The PyRosetta molecular dynamics software suite was used to perform an energy minimization at the interface of the protein structure and the DNA PAM site structure. The energy minimization provided a score that was then compared to the results of empirical characterization of mutant PAM selectivity <cite ref="Kleinstiver2015"></cite>. The pipeline is described in more detail on the <a href="https://2015.igem.org/Team:Waterloo/Modeling/PAM_Flexibility">Pam Flexibility</a> page and is visualized below. |
</p> | </p> | ||
| − | + | <figure> | |
| + | <img src="/wiki/images/2/29/Waterloo_pamflex_pipeline.png" alt="Pipeline showing computational approcah" /> | ||
| + | <figcaption>PAM Flexibility software pipeline: the 3D Cas9 structure is mutated, then 256 variants with different PAM DNA structures are created, then PyRosetta is used to score PAM affinities.</figcaption> | ||
| + | </figure> | ||
<p> | <p> | ||
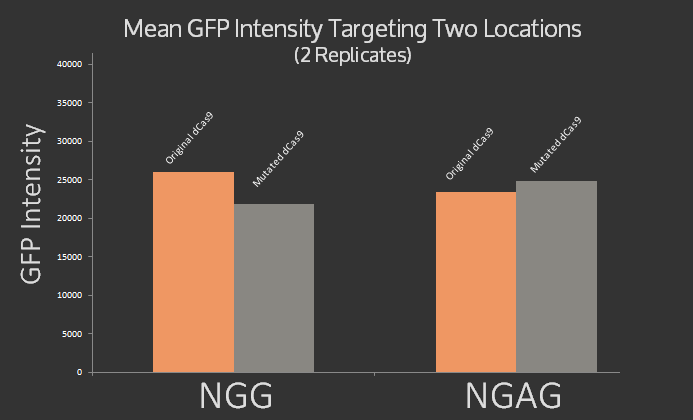
| − | In addition, we | + | In addition, we \mutated dCas9 at three sites 1135, 1335, and 1337 to alter its PAM site from native NGG to NGAG using the Quick Change protocol. The mutations were confirmed using sequencing. Preliminary experiments were done using sgRNA targeting the J23101 promoter upstream of the GFP using NGAG PAM site, however the results, graphed below, were inconclusive. It was expected that the original dCas9 would target NGG but not NGAG, while the modified dCas9 would target NGAG but not NGG. Instead roughly the same signal was measured for both dCas9 variants at both target sites. |
</p> | </p> | ||
| Line 38: | Line 41: | ||
</figure> | </figure> | ||
| − | <p> We were finally able to show that Cas9 was expressed from protoplasts using anti-Cas9 antibodies and dot blots. Additionally, we were able to agroinfiltrate our tentative pCAMBIA + Cas9 + sgRNA vector into <i> Arabidopsis </i>. | + | <p>Working in the we We were finally able to show that Cas9 was expressed from protoplasts using anti-Cas9 antibodies and dot blots. Additionally, we were able to agroinfiltrate our tentative pCAMBIA + Cas9 + sgRNA vector into <i> Arabidopsis </i>. |
<h2>Modeling Results</h2> | <h2>Modeling Results</h2> | ||
Revision as of 00:06, 21 November 2015
Results
The Waterloo iGEM team was able to achieve results for all three project focus areas. This page offers a general summary, while more details can be found on our wet lab overview, mathematical modelling and policy & human practices overview pages.

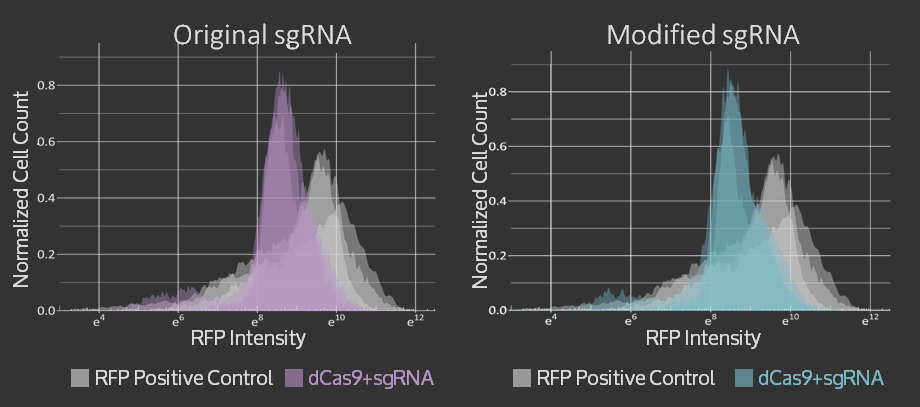
For the Simple sgRNA Exchange, we were able to show that adding restriction sites and a single mutation in the scaffold region of the sgRNA did not reduce targeting of the sgRNA in CRISPR dCas9 system. The graphs of flow cytometry data can be seen below and more details on the results are available on the sgRNA Exchange page.

A software pipeline was developed to determine the PAM-binding selectivity of variant Cas9 proteins. The PyRosetta molecular dynamics software suite was used to perform an energy minimization at the interface of the protein structure and the DNA PAM site structure. The energy minimization provided a score that was then compared to the results of empirical characterization of mutant PAM selectivity . The pipeline is described in more detail on the Pam Flexibility page and is visualized below.
In addition, we \mutated dCas9 at three sites 1135, 1335, and 1337 to alter its PAM site from native NGG to NGAG using the Quick Change protocol. The mutations were confirmed using sequencing. Preliminary experiments were done using sgRNA targeting the J23101 promoter upstream of the GFP using NGAG PAM site, however the results, graphed below, were inconclusive. It was expected that the original dCas9 would target NGG but not NGAG, while the modified dCas9 would target NGAG but not NGG. Instead roughly the same signal was measured for both dCas9 variants at both target sites.

Working in the we We were finally able to show that Cas9 was expressed from protoplasts using anti-Cas9 antibodies and dot blots. Additionally, we were able to agroinfiltrate our tentative pCAMBIA + Cas9 + sgRNA vector into Arabidopsis .
Modeling Results
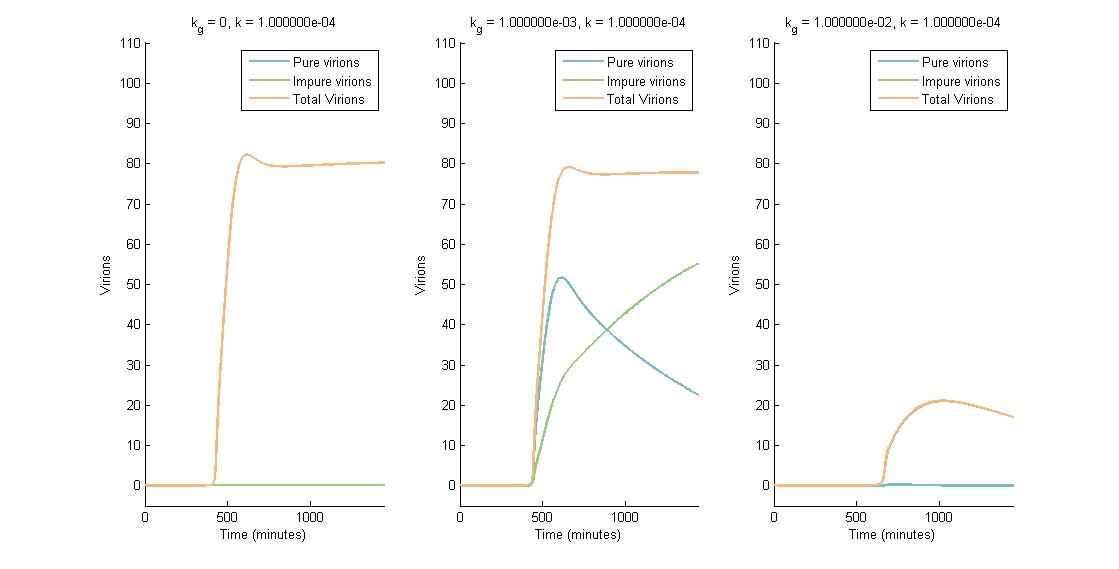
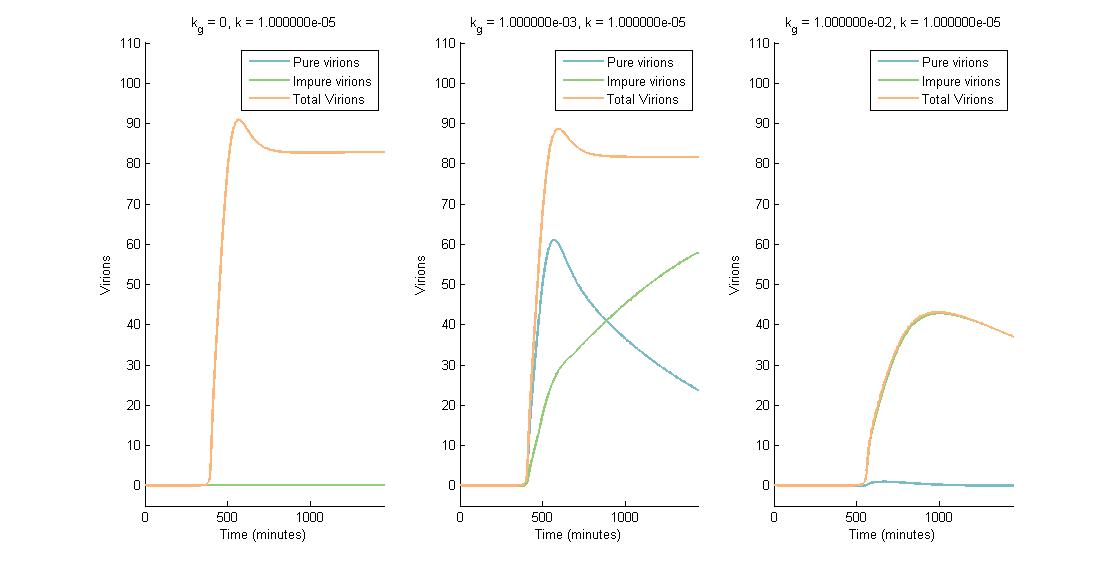
In summary, we were able to examine the CRISPR Plant Defenseaspect of our project using a multi-scale model that showed the effect of CRISPR/Cas9 on viral replication and spread. The intracellular viral replication cycle was simulated in order to determine the steady state virion concentration. This virion concentration was impacted by plant defenses such as RNA silencing and our CRISPR system. The number of virions present in one cell is illustrated in the figures below. In descending graphs, RNAi effectiveness is increased by a factor of 10. Likewise, shifting to the right increases the CRISPR genome modification rate by a factor of 10.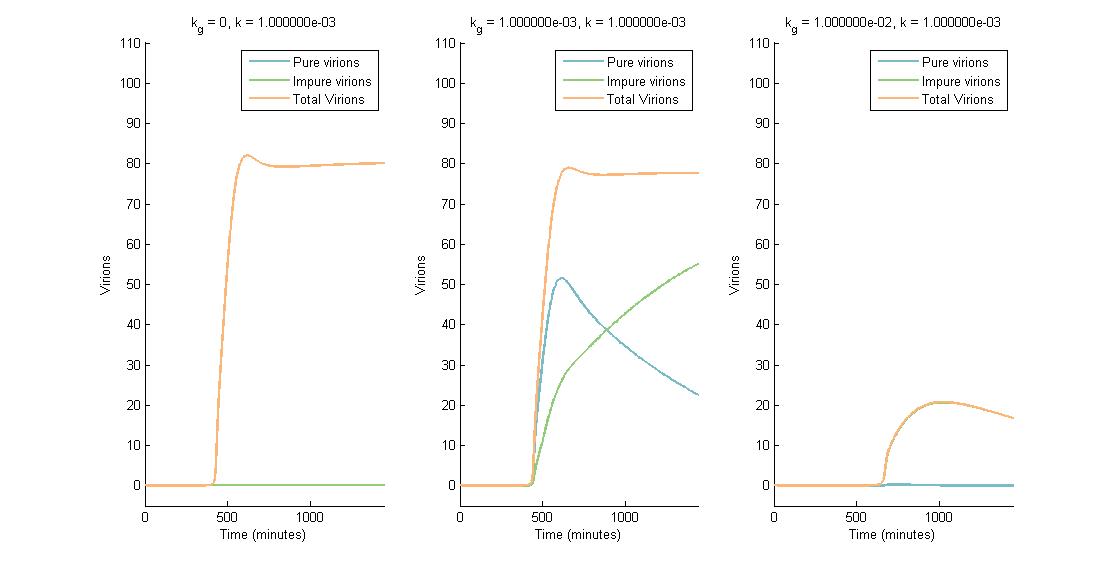
A more detailed analysis of the two-fold impact of both RNAi and CRISPR genome modification on virion concentration is shown in heat maps.
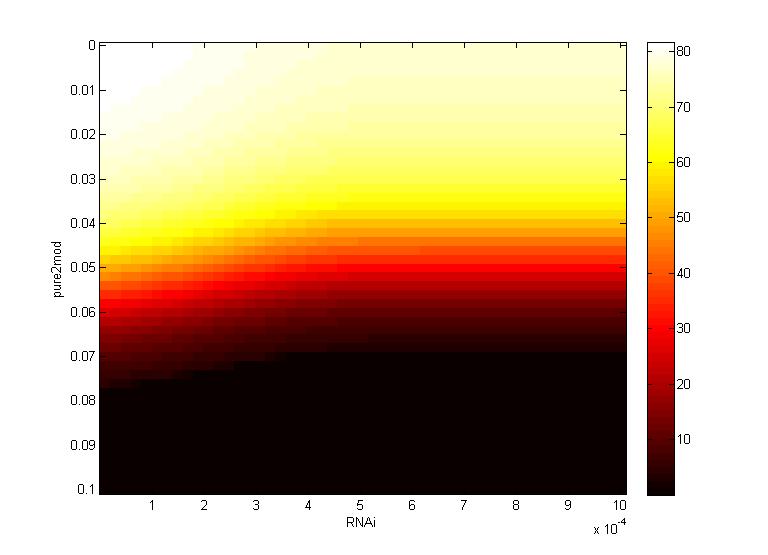
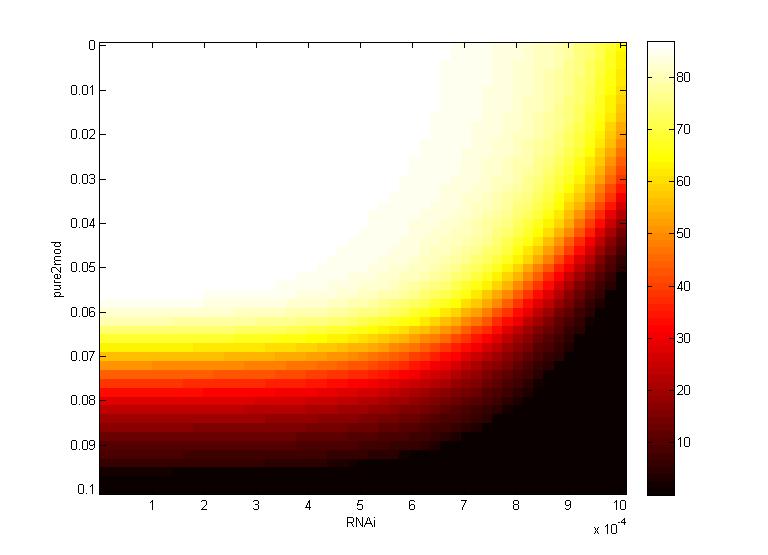
Both the time series data and heat maps highlight how the CRISPR genome modification has a gre ater effect on the virion concentration than the plant defenses alone. These results were then carried forward into an agent-based model on the level of plant leaves, discussed in detail on the Intracellular Spread page.