<a href="https://static.igem.org/mediawiki/2015/8/82/Bielefeld-CeBiTec_Biolector_chromium.jpg" data-lightbox="heavymetals" data-title="Time course of the induction of a chromium biosensor with sfGFP for different chromium concentrations in vivo. The data are measured with BioLector and normalized on OD600. Error bars represent the standard deviation of two biological replicates. ."><img src="https://static.igem.org/mediawiki/2015/8/82/Bielefeld-CeBiTec_Biolector_chromium.jpg" alt="Adjusting the detection limit"></a>
<a href="https://static.igem.org/mediawiki/2015/8/82/Bielefeld-CeBiTec_Biolector_chromium.jpg" data-lightbox="heavymetals" data-title="Time course of the induction of a chromium biosensor with sfGFP for different chromium concentrations in vivo. The data are measured with BioLector and normalized on OD600. Error bars represent the standard deviation of two biological replicates. ."><img src="https://static.igem.org/mediawiki/2015/8/82/Bielefeld-CeBiTec_Biolector_chromium.jpg" alt="Adjusting the detection limit"></a>
<figcaption>Time course of the induction of a chromium biosensor with sfGFP for different chromium concentrations in vivo. The data are measured with BioLector and normalized on OD600. Error bars represent the standard deviation of two biological replicates.</figcaption>
<figcaption>Time course of the induction of a chromium biosensor with sfGFP for different chromium concentrations in vivo. The data are measured with BioLector and normalized on OD600. Error bars represent the standard deviation of two biological replicates.</figcaption>
<a href="https://static.igem.org/mediawiki/2015/7/73/Bielefeld-CeBiTec_Biolector_chromium_Balkendiagramm.jpg" data-lightbox="heavymetals" data-title="Fluorescence levels at three different stages of cultivation. Shown are levels after 60 minutes, 150 minutes and 650 minutes. Error bars represent the standard deviation of three biological replicates."><img src="https://static.igem.org/mediawiki/2015/7/73/Bielefeld-CeBiTec_Biolector_chromium_Balkendiagramm.jpg" alt="Adjusting the detection limit"></a>
<a href="https://static.igem.org/mediawiki/2015/7/73/Bielefeld-CeBiTec_Biolector_chromium_Balkendiagramm.jpg" data-lightbox="heavymetals" data-title="Fluorescence levels at three different stages of cultivation. Shown are levels after 60 minutes, 150 minutes and 650 minutes. Error bars represent the standard deviation of three biological replicates."><img src="https://static.igem.org/mediawiki/2015/7/73/Bielefeld-CeBiTec_Biolector_chromium_Balkendiagramm.jpg" alt="Adjusting the detection limit"></a>
<figcaption>Fluorescence levels at three different stages of cultivation. Shown are levels after 60 minutes, 150 minutes and 650 minutes. Error bars represent the standard deviation of three biological replicates.</figcaption>
<figcaption>Fluorescence levels at three different stages of cultivation. Shown are levels after 60 minutes, 150 minutes and 650 minutes. Error bars represent the standard deviation of three biological replicates.</figcaption>
</figure>
</figure>
+
</div>
+
</div>
+
+
+
+
+
</br><p>Our data lead to the conclusion that in a cell based system it is possible to detect chromium.
</br><p>Our data lead to the conclusion that in a cell based system it is possible to detect chromium.
In contrast to our expectations with higher chromium concentrations we got lower fluorescence levels. These observations needed further investigation. </p>
In contrast to our expectations with higher chromium concentrations we got lower fluorescence levels. These observations needed further investigation. </p>
<a href="https://static.igem.org/mediawiki/2015/b/bd/Bielefeld-CeBiTec_induction_chromium_in_chrB_optimized_cell_extract2.jpg" data-lightbox="heavymetals" data-title="Chromium sensor with alternative repressor build by team Dundee 2015, which has only the first 15 codons optimized in chromium specific cell extract under the induction withdifferent chromium concentrations. Error bars represent the standard deviation of three biological replicates."><img src="https://static.igem.org/mediawiki/2015/b/bd/Bielefeld-CeBiTec_induction_chromium_in_chrB_optimized_cell_extract2.jpg" alt="Adjusting the detection limit"></a>
<a href="https://static.igem.org/mediawiki/2015/b/bd/Bielefeld-CeBiTec_induction_chromium_in_chrB_optimized_cell_extract2.jpg" data-lightbox="heavymetals" data-title="Chromium sensor with alternative repressor build by team Dundee 2015, which has only the first 15 codons optimized in chromium specific cell extract under the induction withdifferent chromium concentrations. Error bars represent the standard deviation of three biological replicates."><img src="https://static.igem.org/mediawiki/2015/b/bd/Bielefeld-CeBiTec_induction_chromium_in_chrB_optimized_cell_extract2.jpg" alt="Adjusting the detection limit"></a>
<figcaption>Chromium sensor with alternative repressor build by team Dundee 2015, which has only the first 15 codons optimized in chromium specific cell extract under the induction withdifferent chromium concentrations. Error bars represent the standard deviation of three biological replicates.</figcaption>
<figcaption>Chromium sensor with alternative repressor build by team Dundee 2015, which has only the first 15 codons optimized in chromium specific cell extract under the induction withdifferent chromium concentrations. Error bars represent the standard deviation of three biological replicates.</figcaption>
<a href="https://static.igem.org/mediawiki/2015/f/fe/Bielefeld-CeBiTec_Corr-induction-Cr-in-ChrBopt-CE.jpeg" data-lightbox="heavymetals" data-title="Chromium sensor with alternative repressor build by team Dundee 2015, which has only the first 15 codons optimized in chromium specific cell extract under the induction withdifferent chromium concentrations. Error bars represent the standard deviation of three biological replicates.Data are normalised on chromiums influence to the cell extrat. "><img src="https://static.igem.org/mediawiki/2015/f/fe/Bielefeld-CeBiTec_Corr-induction-Cr-in-ChrBopt-CE.jpeg" alt="Adjusting the detection limit"></a>
<a href="https://static.igem.org/mediawiki/2015/f/fe/Bielefeld-CeBiTec_Corr-induction-Cr-in-ChrBopt-CE.jpeg" data-lightbox="heavymetals" data-title="Chromium sensor with alternative repressor build by team Dundee 2015, which has only the first 15 codons optimized in chromium specific cell extract under the induction withdifferent chromium concentrations. Error bars represent the standard deviation of three biological replicates.Data are normalised on chromiums influence to the cell extrat. "><img src="https://static.igem.org/mediawiki/2015/f/fe/Bielefeld-CeBiTec_Corr-induction-Cr-in-ChrBopt-CE.jpeg" alt="Adjusting the detection limit"></a>
<figcaption>Chromium sensor with alternative repressor build by team Dundee 2015, which has only the first 15 codons optimized in chromium specific cell extract under the induction withdifferent chromium concentrations. Error bars represent the standard deviation of three biological replicates.Data are normalised on chromiums influence to the cell extrat.</figcaption>
<figcaption>Chromium sensor with alternative repressor build by team Dundee 2015, which has only the first 15 codons optimized in chromium specific cell extract under the induction withdifferent chromium concentrations. Error bars represent the standard deviation of three biological replicates.Data are normalised on chromiums influence to the cell extrat.</figcaption>
The different sensors we worked with were characterized in vivo as well as in vitro.
We tested the influence of each heavy metal on our sensors in vivo Therefore we used heavy metal concentrations based on heavy metal occurrences measured all over the world.
Influence of heavy metals on the growth of E.coli KRX shown is the standard deviation of three biological replicates. For induction concentrations of
20 µg/L lead, 60 µg/L mercury, 60 µg/L chromium, 80 µg/L nickel, 40 mg/L copper which represent ten times of the WHO guideline were used.
The tested heavy metal concentrations had no negative effect on E. colis growth. Moreover there is no significant difference between the curves with heavy metals and the controls. This first experiment showed us, in vivo characterization with these sensors under the tested heavy metal concentrations is possible. Most of our sensors were cultivated in the BioLector. Due to the accuracy of this device we could measure our sample in duplicates.
Click on the test strip for more information about the heavy metals and how they can be detected:
Arsenic
Genetic build-up of the arsenic biosensor we used for in vivo characterization. Both the repressor (arsR) and the reporter (mRFP1) are under the control of the same promoter, which is controlled by ArsR.
We choose to work with the chromosomal arsenic operon of E. coli, which was used by the team from Edinburgh in 2006. This operon encodes an efflux pump which confers resistance against arsenic. The expression is controlled by the repressor ArsR, which negatively autoregulates its own expression. AsIII can bind to three cysteine residues in ArsR. The resulting conformational change deactivates the repressor (Chen, Rosen 2014).
By placing a reporter gene downstream of arsR, an arsenic biosensor can be constructed. In this case, both the repressor and the reporter are under the control of the same promoter. In this respect, the arsenic sensor is different from the other heavy metal biosensors we worked with, as their repressors or activators are expressed constitutively. However, the genetic build-up of the arsenic sensor is well established. Consequently, we decided to keep this deviating design.
in vivo
We tested an arsenic sensor with mRFP1 as reporter gene in vivo to confirm that the sensor is functional and test whether it is possible to detect the safety limit as defined by the WHO. We observed a reaction approximately five hours after addition of arsenic. The safety limit of 10 µg/L could clearly be distinguished from the negative control and the fluorescence signal increased up to a concentration of 500 µg/L. The signal in the presence of 1000 µg/L was slightly lower than in the presence of 500 µg/L.
Time course of the induction of an arsenic biosensor with RFP for different arsenic concentrations in vivo. Error bars represent the standard deviation of three biological replicates.
in vitro
Genetic structure of BBa_K1758300, which was used for characterization of the arsenic sensor in vitro. The arsenic operator was placed downstream of the T7 promoter in order to control the expression of sfGFP in the presence of the arsenic repressor, ArsR.
E. coli is resistant to arsenic because it posseses an efflux pump. The cell extract is not protected by such mechanisms, therefore we tested the effect of arsenic on the synthesis of sfGFP. We observed no significant effect for the relevant safety limits of 10 µg/L and 50 µg/L.
Influence of arsenic on cell-free protein synthesis.
In order to test the arsenic sensor in our cell-free protein synthesis, we cloned a device that contains the arsenic operator between the T7 promoter and sfGFP with our optimized untranslated region (UTR). We tested this device in a cell extract that had been generated from cells expressing the arsenic repressor. We observed an induction when adding arsenic up to a concentration of 1.87 mg/L. As high arsenic concentrations inhibit the performance of the CFPS, we normalized the results for this effect. In the final application, this task is performed by our app.
Induction of arsenic sensor in vitro. For this experiment, a cell extract which already containes the arsenic repressor was used. Error bars represent the standard deviation of three biological replicates.
Compared to the in vivo results, the response to arsenic was relatively small and we measured a high background signal. We assume that this is due to the different construct we used in vitro. This construct had been optimized for our CFPS by exchanging the natural promoter for the T7 promoter and exchanging mRFP1 for our optimized sfGFP. However, we assume that the repression in the presence of ArsR was not effective enough to observe a clear induction. The reason is most likely that the distance between the T7 promoter and the arsenic operator was too large. The distance was a result of our cloning strategy and would likely be suitable for E. coli promoters. However, the T7 promoter requires the operator to be very close for an efficient repression (Karig et al. 2012).
In addition, we performed an experiment in which the arsenic repressor was not present in the reaction from the beginning, but was encoded on a second plasmid. The plasmid concentrations we used had been predicted by our model. In accordance with the aforementioned results, we observed no clear repression and addition of arsenic showed no effect. This experiment is discussed on the Modeling pages.
References
Chen, Jian; Rosen, Barry P. (2014): Biosensors for inorganic and organic arsenicals. In Biosensors 4 (4), pp. 494–512. DOI: 10.3390/bios4040494.
Karig, David K.; Iyer, Sukanya; Simpson, Michael L.; Doktycz, Mitchel J. (2012): Expression optimization and synthetic gene networks in cell-free systems. In Nucleic acids research 40 (8), pp. 3763–3774. DOI: 10.1093/nar/gkr1191.
Chromium
Chromium is an essential part of the earth´s crust, but most of it is produced trough industrial uses. We built a biosensor for the detection of hexavalent (CrVI), because it is toxic and has cancerogenic effects on the human body. An intoxication of chromium can lead to damages of the nervous system. The World Health Organization recommends a limit of 50µg/L in drinking water.
in vivo
The chromium sensor (BBa_K1758313) was constructed by using the basic construction we showed in Our biosensors. We work with the chromate inducible operon of Ochrobactrum tritici 5bvl1 which enables a resistance for chromium VI and superoxide. For our Sensor we used the Cr (VI) dependent repressor chrB which was introduced by team BIT 2013 (BBa_K1058007), and optimized this sequence for the use in E. coli . The associated chromium responsive promoter is ChrP (introduced by BIT 2013 (BBa_K1058007). For output we used sfGFP and a 5’UTR untranslated region in front of sfGFP to optimize the expression of the reporter protein and increase its fluorescence.
Our sensor for chromium detection consists of ChrB the repressor and the chromate specific promoter ChrP. The promoter is regulated by the Chr Construct kProm + ChrB+ChrP+UTR-sfGFP BBa_K1758313 consisting of konst.Prom + ChrB BBa_K17583210 and ChrP-5-UTR-sfGFP BBa_K1758312 used forin vivo characterization., which binds Cr-ions. Behind the promoter is a sfGFP for detection of a fluorescence signal.
In vivo we could show that the addition of different concentrations of chromium have different effects to transcription of sfGFP.
Time course of the induction of a chromium biosensor with sfGFP for different chromium concentrations in vivo. The data are measured with BioLector and normalized on OD600. Error bars represent the standard deviation of two biological replicates.
Fluorescence levels at three different stages of cultivation. Shown are levels after 60 minutes, 150 minutes and 650 minutes. Error bars represent the standard deviation of three biological replicates.
Our data lead to the conclusion that in a cell based system it is possible to detect chromium.
In contrast to our expectations with higher chromium concentrations we got lower fluorescence levels. These observations needed further investigation.
in vitro
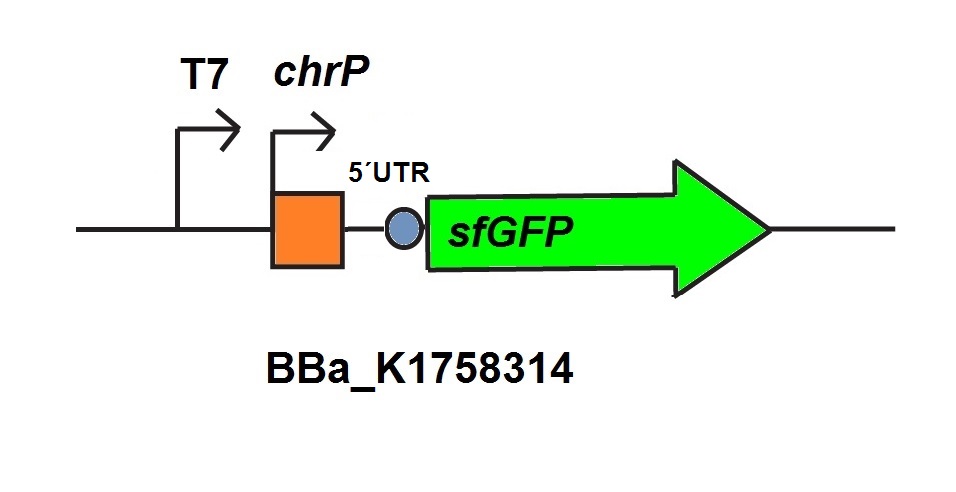
For the characterization of the chromium sensor with CFPS we used parts differing from that we used in vivo characterization. For the in vitro characterization we used a cell extract out of cells which contain the Plasmid (BBa_K1758310). In addition to that we added Plasmid-DNA of the chromium specific promoter ChrP with 5’UTR-sfGFP under the control of T7-promoter (BBa_K1758314)to the cell extract. The T7-promoter is needed to get a better fluorescence expression.
konst.Prom + ChrB BBa_K1758314 used forin vitro characterization.
T7-chrP-UTR-sfGFP BBa_K1758314 used forin vitro characterization.
Influence of different chromium concentrations on our crude cell extract. Error bars represent the standard deviation of three biological replicates.Chromium specific cell extract made from E. coli cells which already expressed the repressor before cell extract production. Induction with different chromium concentrations. Error bars represent the standard deviation of three biological replicates.Chromium specific cell extract made from E. coli cells which already expressed the repressor before cell extract production. Induction with different chromium concentrations. Error bars represent the standard deviation of three biological replicates.Data are normalised on chromiums influence to the cell extrat.
Chromium sensor with alternative repressor build by team Dundee 2015, which has only the first 15 codons optimized in chromium specific cell extract under the induction withdifferent chromium concentrations. Error bars represent the standard deviation of three biological replicates.
Chromium sensor with alternative repressor build by team Dundee 2015, which has only the first 15 codons optimized in chromium specific cell extract under the induction withdifferent chromium concentrations. Error bars represent the standard deviation of three biological replicates.Data are normalised on chromiums influence to the cell extrat.
To sum it up
Our chromium sensor detects the presence of chromium in vivo, but the outcome differed from our expectations. We would have expected an increase in fluorescence by increasing chromium concentrations. Our in vitro data suggest that these decrease in fluorescence could be explained by chromium’s influence on E. coli which is not reflected in growth but shown by chromium´s influence on the cell extract. Before normalizing the in vitro data the same pattern as in vivo could be observed. After normalization an increase in signal is noticeable. Therefore with optimization our chromium sensor would be compatible to our cell free sensor system.
Copper
There are some possibilities for the contamination of drinking water with copper, for the production of pipes, valves and fittings copper is used. Copper is an essential trace element for humans, animals and plants, but an overdose can lead to anemia, liver and brain damages. Additionally high input of copper is associated with aging diseases as Atherosclerosis and Alzheimer’s disease. These damages can finally cause death. The World Health Organization recommends a limit of 2 mg/L in drinking water.
in vivo
Our sensor for copper detection consists of CueR a MerR like activator and the copper specific promoter CopAP. The promoter is regulated by CueR, which binds Cu2+-ions. We also used a sfGFP behind the promoter for detection trough a fluorescence signal.
For our copper sensor we used the native operator of cooper homeostasis from E.coli K12. And constructed a part (BBa_K1758324) which was constructed using the basic construction showed in Our biosensors.This operator includes the promoter (copAP), which is regulated by the repressor CueR. This is an important part for the aerobic copper tolerance. In BBa_K1758324 we combined the codon optimized CueR (BBa_K1758320) under the control of a constitutive promoter with CopAP and sfGFP (BBa_K1758321) for measuring output signals. Through the addition of a 5’UTR before the sfGFP we optimized the expression of sfGFP and increased fluorescence.
Construct konst.Prom + CueR+CopAP-UTR-sfGFP BBa_K1758324 consisting of konst.Prom + CueR BBa_K1758324 and CopAP-UTR-sfGF BBa_K1758323 used forin vivo characterization.Time course of the induction of a copper biosensor with sfGFP for different copper concentrations in vivo. The data are measured with BioLector and normalized on OD600. Error bars represent the standard deviation of two biological replicates.
In vivo we could show that the adding different concentrations of copper has effects on the transcription levels of sfGFP.
Fluorescence levels at three different stages of cultivation. Shown are levels after 60 minutes, 150 minutes and 650 minutes.
The shown data suggest that sensing copper with our device is possible even if the detectable concentrations are higher than the desireble sensitivity limits. Therfore we tested the copper sensor in our in vitro transcription translation approach.
in vitro
For the characterization of the copper sensor with CFPS we used parts differing from that we used in vivo characterization. For the in vitro characterization we used a cell extract out of cells which contain the Plasmid (BBa_K1758320). In addition to that we added Plasmid-DNA of the copper specific promoter copAP with 5’UTR-sfGFP under the control of T7-promoter (BBa_K1758325)to the cell extract. The T7-promoter is needed to get a better fluorescence expression.
konst.Prom + CueR BBa_K1758320 used forin vitro characterization.
T7-copAP-UTR-sfGFP BBa_K1758325 used forin vitro characterization.
In the following graphic the influences of different copper concentrations on the cell extact are shown
Influence of different copper concentrations on our crude cell extract. Error bars represent the standard deviation of three biological replicates.
As shown above copper has no negatice influence on the functuality of our cell extact. Therefore a ralatively stable system for copper sensing is provided.
First tests with specific cell extract and different copper concentrations lead to further tests and normilisations.
Copper specific cell extract made from E. coli cells which have already expressed the activator before cell extract production. Induction of copper inducible promoter without T7 in front of the operator site with different copper concentrations. Error bars represent the standard deviation of three biological replicates.
Fluorescences normalised on coppers influence to the cell extract are shown above.
Copper specific cell extract made from E. coli cells which have already expressed the activator before cell extract production. Induction of copper inducible promoter without T7 in front of the operator site with different copper concentrations. Error bars represent the standard deviation of three biological replicates. Data are normalized on coppers influence to the cell extract.
In addition to the native promoter, operator device as measured above reporter constructs under the control of T7 promoter were tested.
Copper specific cell extract made from E. coli cells which have already expressed the activator before cell extract production. Induction with different copper concentrations. Error bars represent the standard deviation of three biological replicates.
Compared to the former fluorecence leves the T7 reporter device showed higher levels therefore a reporter device under the control of T7 promoter is more suitable for our CFPS.
Copper specific cell extract made from E. coli cells which have already expressed the activator before cell extract production. Induction of copper inducible promoter with different copper concentrations. Error bars represent the standard deviation of three biological replicates. Data are normalized on coppers influence to the cell extract.
After normalising on coppers influcence to the cell extract these differecnces were even more obvious.
To sum it up
Our copper sensors in vivo data show that detection of different copper concentrations is possible. The fluorescence levels defer clearly between different induction concentrations. As shown above higher copper concentration, higher the fluorescence signal. Therefore the concept of our sensor is functional even if the concentration needed for induction are to high to reach sensitively concerning the WHO guidelines for copper. Our sensor has been tested in vitro as well. For copper we tested our original CopAP construct without a T7 promoter in front of the inducible at first. After realizing that the sensor shows the right tendencies but the general fluorescence is quite low we created an inducible promoter under the control of a T7 promoter to use in CFPS. Fluorescence levels of this device showed the same tendencies as the one without but were higher fluorescence’s, which helps detecting it.
Lead
Lead is one of the most used metals, because of this lead is found in different parts of the environment. The contamination of drinking water is often based on obstruct pipes. Long time absorption leads to adverse health effects in most organs in the body. The main targets are the nervous system, brain and liver. These damages can finally cause death. The World Health Organization recommends a limit of 10 µg/L in drinking water.
in vivo
In addition to these we constructed a sensor for lead detection. It consists of PbrR, the repressor, and the lead specific promoter PbrA. The promoter is regulated by the RcnR, which binds Pb-ions. As the former sensors this one encloses a sfGFP for detection via fluorescence.
Our lead sensor consists of parts of the chromosomal lead operon of Cupriavidusmetallidurans (Ralstoniametallidurans) . This operon includes the promoter PbrA (BBa_K1758332 ) , which is regulated by the repressor pbrR. The PbrR belongs to the MerR family, of metal-sensing regulatoryproteins, and is Pb2+-inducible. Our sensor system comprises PbrR ( BBa_K1758330 ), which is under the control of a constitutive Promoter and PbrA and a 5’ untranslated region, which controls the transcription of a sfGFP and increases the fluorescence. Fluorescence implemented by sfGFP protein is the measured output signal.
Construct konst.Prom + PbrR+CopAP-UTR-sfGFP BBa_K1758334 consisting of konst.Prom + PbrR BBa_K17583230 and PbrA-UTR-sfGF BBa_K1758333 used forin vivo characterization.Time course of the induction of a lead biosensor with sfGFP for different lead concentrations in vivo. The data are measured with BioLector and normalized on OD600. Error bars represent the standard deviation of two biological replicates. Fluorescence levels at three different stages of cultivation. Shown are levels after 60 minutes, 150 minutes and 650 minutes. Error bars represent the standard deviation of three biological replicates.
The differences between inductions with various lead concentrations are really slight therefore this sensor needs further optimization which was not possible in this limited time. But as there is a fluorescence response to lead this sensor has the potential work as expected. In the future a characterization in CFPS systems would be interesting.
To sum it up
Our lead sensor was characterized in vivo only. The differences between inductions with various lead concentrations are really slight therefore this sensor needs further optimization which was not possible in this limited time. But as there is a fluorescence response to lead this sensor has the potential work as expected. In the future a characterization in CFPS systems would be interesting.
Mercury
The main sources of mercury exposure are generated through humans. For example mercury contamination can be caused by medical waste (damaged measurement instruments), Fluorescent-lamps, Chlor- Alkali plants and thermal power plants. In the environment, mercury is one of the most toxic elements. Acute effects of a mercury intoxication can range from diseases of the Liver, kidney, gastrointestinal tract, to Neuromuscular and neurological problems. A chronic intoxication of mercury results in kidney changes, changes in the central nervous system and other effects like cancer. The World Health Organization recommends a limit of 6 µg/L in drinking water.
in vivo
One of the already existing sensors we use for our system is the mercury sensor consisting of MerR the activator and the mercury specific promoter MerT. The promoter is regulated by the MerR, which binds Hg-ions. Similar to the former sensors we added a sfGFP for detection via fluorescence.
For our mercury sensor we use parts of the mercury sensor constructed by iGEM team Peking 2010. The parts of iGEM team Peking 2010 consist of the mercury dependent Mer operon from shigella flexneri R100 plasmid Tn21. The expression of the Mer operon is depends on the regulation by MerR its activator and promoter MerT. For our sensor we used the codon optimized activator (BBa_K1758340), under control of a constitutive promoter, of iGEM Peking 2010 (BBa_K346001). Additionally to the activator of Peking 2010 we used the specific promoter MerT (BBa_K346002) from this team. For our sensor we added a 5’UTR behind this promoter to increase the fluorscence of the used reporter protein sfGFP.
Construct konst.Prom + MerR+MerT-UTR-sfGFP BBa_K1758344 consisting of konst.Prom + MerR BBa_K1758340 and MerT-UTR-sfGF BBa_K1758342 used forin vivo characterization.During cultivation the sfGFP signal in reaction to different mercury concentrations was measured. The induction with mercury happened after 165 minutes. Error bars represent the standard deviation of three biological replicates.
In vivo data show a highly significant, well working sensor which even reacts to concentrations which are mentioned as drinking water guidelines by the WHO.
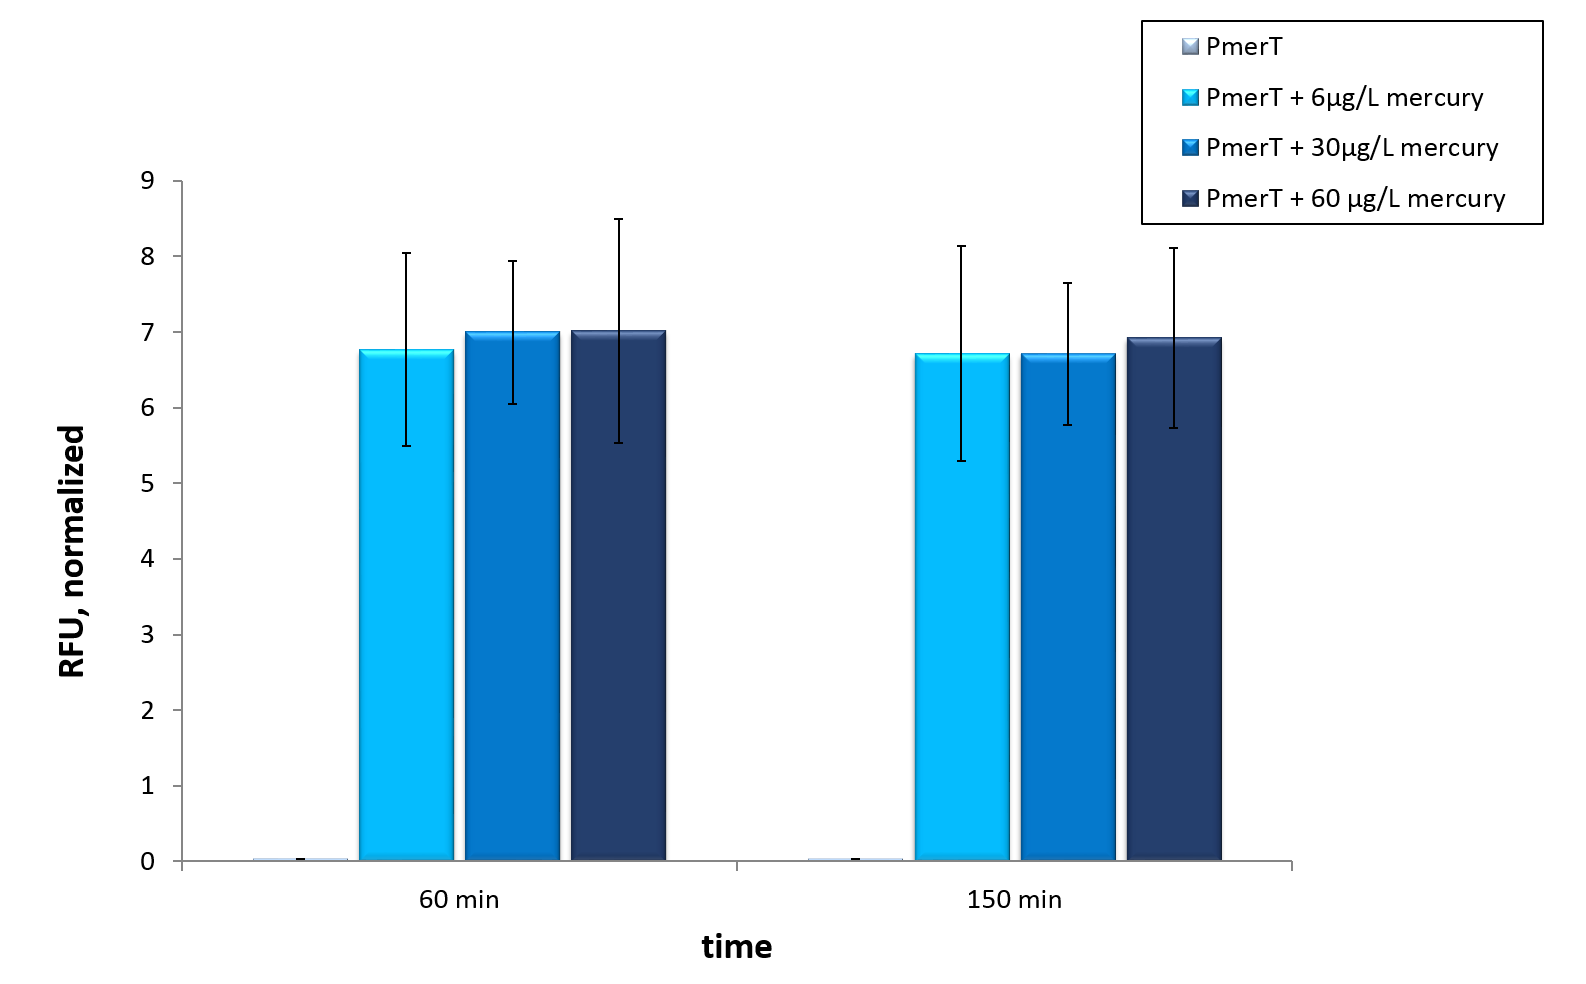
Fluorescence levels at two different stages of cultivation. Shown are levels after 120 minutes and 190 minutes. Error bars represent the standard deviation of three biological replicates.
The mercury detection was measured during the cultivation of E. coli KRX at 37 °C. The strain contains the plasmid with the activator MerRunder the control of a constitutive promoter and the specific promoter with operator site which reacts to the activator with bound Hg-ions. The specific promoter is in front of sfGFP for measurment , so the mercury in the medium is detected directly.In vivo this sensor devise shows a fast answer to occurrence of his heavy metal contrary to the other sensor systems in vivo.
Therefore we tested our sensor in vitro to check if an already functioning highly optimized sensor provides required data for guideline detections
in vitro
For the characterization of the mercury sensor with CFPS we used parts differing from that we used in vivo characterization. For the in vitro characterization we used a cell extract out of cells which contain the Plasmid ( BBa_K1758340). In addition to that we added Plasmid-DNA of the copper specific promoter merT with 5’UTR-sfGFP under the control of T7-promoter ( BBa_K1758344)to the cell extract. The T7-promoter is needed to get a better fluorescence expression.
konst.Prom + MerR BBa_K175840 used forin vitro characterization.
T7-merT-UTR-sfGFP BBa_K175844 used forin vitro characterization.
Influence of different mercury concentrations on our crude cell extract. Error bars represent the standard deviation of three biological replicates.Mercury specific cell extract made from E. coli cells which have already expressed the activator before cell extract production. Induction of mercury inducible promoter without T7 in front of the operator site with different mercury concentrations. Error bars represent the standard deviation of three biological replicates.Mercury specific cell extract made from E. coli cells which have already expressed the activator before cell extract production. Induction of mercury inducible promoter without T7 in front of the operator site with different mercury concentrations. Error bars represent the standard deviation of three biological replicates.
To sum it up
Our mercury sensor works well in vivo as data show. There is a clearly noticeable increase in fluorescence after induction with mercury. Even the WHO guideline is measurable. This well working sensor was tested in in vitroas well. Taken data suggest, that maximal output is reached at concentrations of 6µg/L, which represent the former mentioned WHO guideline. With optimization a detection of even lower concentrations could be possible in vitro.
Nickel
Naturally Nickel occurrences are quite low. In Germany most drinking water pollutions by nickel happen in the last meters of the plumbing system. The reason for these pollutions are wrong tap ware (kreusche). There may be higher concentrations in drinking-water in special cases of release from natural or industrial nickel deposits. Higher nickel concentrations in water can lead to dermatitis as itching of fingers and other parts of the body through long term skin contact. The World Health Organization recommends a limit of 70 µg/L in drinking water.
in vivo
In addition to these we aimed to construct a sensor for nickel detection. It consists of RcnR the repressor and the nickel specific promoter RcnA. The promoter is regulated by the RcnR, which binds Ni-ions. As the former sensors this one encloses a sfGFP for detection via Fluorescence.
Our Nickel biosensor consists of parts of the rcn-operon from E. coli which codes for a nickel- and cobalt-efflux system. This system is highly sensitive to nickel. In absence of nickel or cobalt RcnR binds to the operator and inhibits the nickel responsive promoter. With Ni(II)-ions present the repression of the promoter RcnA will be reversed, because the repressor RcnR binds nickel-ions and cannot attach to the DNA. For our biosensor we construct the part ( BBa_K1758353 by using the basic construction showed in . For this part we used the repressor RcnR under control of a constitutive promoter ( BBa_K1758350 ) and the nickel specific promoter RcnA with a 5’UTR in front of sfGFP ( BBa_K1758352 ) as reporter protein.
Construct konst.Prom + rcnR+rcnA-UTR-sfGFP BBa_K1758354 consisting of konst.Prom + rcnR BBa_K1758340 and rcnA-UTR-sfGF BBa_K1758352 used forin vivo characterization.
Our Nickel biosensor consists of parts of the rcn-operon from E. coli which codes for a nickel- and cobalt-efflux system. This system is highly sensitive to nickel. In absence of nickel or cobalt RcnR binds to the operator and inhibits the nickel responsive promoter. With Ni(II)-ions present the repression of the promoter RcnA will be reversed, because the repressor RcnR binds nickel-ions and cannot attach to the DNA. For our biosensor we construct the part ( BBa_K1758353 by using the basic construction showed in . For this part we used the repressor RcnR under control of a constitutive promoter ( BBa_K1758350 ) and the nickel specific promoter RcnA with a 5’UTR in front of sfGFP ( BBa_K1758352 ) as reporter protein.
Time course of the induction of a lead biosensor with sfGFP for different nickel concentrations in vivo. The data are measured with BioLector and normalized on OD600. Error bars represent the standard deviation of two biological replicates. Fluorescence levels at three different stages of cultivation. Shown are levels after 60 minutes, 150 minutes and 650 minutes. Error bars represent the standard deviation of three biological replicates.
With this sensor no production of sfGFp via fluorescence level change could be detected. Therefore this sensor is not suitable for approach. Therefore no in vitro data using CFPS were taken.
To sum it up
With this sensor no production of sfGFP via fluorescence level change could be detected. Therefore this sensor is not suitable for our approach. Therefore no in vitro data using CFPS were taken.
To create a working sensor based on this concept further optimization is needed.
To sum it all up
We have characterized different heavy metal sensors for arsenic, chromium, copper, lead, mercury and nickel. The results for our nickel characterization indicated that the constructed nickel sensor is not suitable for our test strip. The sensors for lead and chromium showed great potential to become fitting sensors, as they show responses to chromium or lead. Copper our new heavy metal sensor already works as expected and detects different copper concentrations by difference in fluorescence. The already well working sensors for arsenic and mercury were tested, too. While arsenic needs some optimization to exploit its full potential even if it works in vitro as well as in vivo. Mercury showed that a fully optimized sensor which is adjusted to our in vitro system works desirable and has potential to detect even lower concentrations than in vivo.