Team:Brasil-USP/Parts/KI
BioBrick characterization
Parts

Table of contents
An important part in iGEM competition is to contribute to Registry database with reliable information that hopefully will help other people.
Veg locus promoter: Pveg
Pveg is a strong constitutive promoter well studied in Bacillus subtilis, especially during the vegetative growth phase and sporulation (controlled primarily by the veg gene). Currently available at Registry as BioBrick K823003, it was characterized using a β-galactosidase assay by team LMU-Munich, as well as published in a recent paper [1].
While originally designed for B. Subtilis, during the 2014 iGEM edition Brasil-SP team proposed a protocol to express it in E. Coli (DH5α strain). Repeating this procedure with a gfp gene, we can now perform experiments similar to the β-galactosidase assays and evaluate how strong Pveg is in E. Coli. For instance, we can evaluate it and compare with promoters from the Anderson library [2]. The part and its base BioBricks are represented in figure 1. This question seemed especially interesting given that promoters in the Anderson library were employed in Bacillus subtilis before and Pveg was shown to be 100 times more efficient than J23101 [1], a promoter from the Anderson library we have used as benchmark. We will show that this does not seem to hold for E Coli: Pveg induces less fluorescence that J23101.
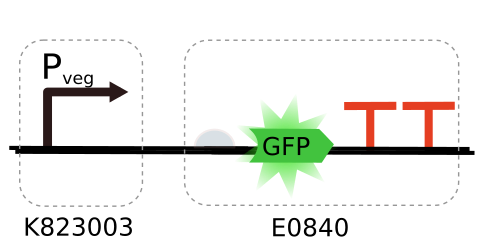
Figure 1 - Part used to characterize Pveg constitutive promoter using E. Coli (DH5α strain). Both K823003 and E0840 were parts available in the 2014 iGEM kit. Note that this biobrick was proposed and studied considering Baccilus subtilis originally.
We shall refer to this assembly as KI circuit, using the same nomenclature as Brasil-SP team. In the following sections, we briefly describe our protocols and our main results. Use the Table of Contents in the left panel to quickly navigate.
Characterization results
In this experiment, we wanted to measure the how strong KI is when compared to J23101. We started checking the Optical Density (OD) of our samples and all of our colonies were in the log phase (see below the average OD for each category). This is an important observation to evaluate the promoter strength of Pveg. LB levels show a zero-level for cellular concentration, and all other categories are considerably larger. Interestingly, KI shows a much lower OD than, for instance, J23101. Our positive control I20270 is the same used in our Interlab Study. One could argue that this is a signal that Pveg may exhaust the cells in order to promote its genes.

Figure 2 - Showing a growing Optical Density (OD) as function of time. All colonies are in their respective log phase, except for LB which has no bacteria indeed.
Using the measured OD, we now present the fluorescence per cell for each of these categories. Although KI has a very low concentration of cells, their fluorescence seems to be as strong as J23101. See below

Figure 3 - Fluorescence per cell after 8 hours of experiment. Although J23101 is always strong, KI present a rather large variation across population. This should definitely impact our evaluation of promoter strength.
Both KI and J23101 are definitely stronger than our controls, as one would expect, however KI shows quite large variation across colonies. This detail is also seen in the time evolution shown in figure 4.

Figure 4 - Comparing fluorescence per cell over time. It seems that KI drops significantly after a couple of hours. Yet, it is definitely stronger than our positive and negative controls.
To better illustrate how stronger J23101 and KI are compared to the controls, we show below their activity divided by the activity of our negative control. They are almost 20 times stronger than the negative control, and 10 times stronger than the positive one. Notice that over time J23101 seems to show a strong response.

Figure 5 - Comparing J23101 and KI with the negative and positive controls.
Finally, calculating the promoter strength in each case using the formula
\[ RPU_{\phi} = \frac{ \left\langle \frac{dF_{\phi}}{dt}\frac{1}{OD_{\phi}} \right\rangle }{ \left\langle \frac{dF_{J101}}{dt}\frac{1}{OD_{J101}} \right\rangle } \]we show in figure 6 that Pveg is indeed weaker (almost by half) than J23101. As expected, -control is almost zero and +control agrees with our result during the Interlab Study.

Figure 6 - Promoter strengths using Relative Promoter Unites (RPU). We show that J23101 is considerably stronger than Pveg when used in E Coli. This contradicts results from Bacillus subilis, where Pveg can be up to 100 times stronger [1].
Discussion
We have shown how Pveg (K823003) behaves in E. Coli, strain DH5α, and compared it to a benchmark with respect to Anderson Promoter Library: J23101. In fact, this comparison was already been made using Bacillus subtilis and Pveg was demonstrated 100 times stronger than J23101 [1]. However, by changing from Bacillus subtilis chassis to E. Coli’s, we have shown that Pveg loses its overwhelming strength and becomes comparable to J23101 (Device 2 in Interlab Study). This information is potentially useful for any user interested in using Pveg in different chassis, and shows that, when the chassis is changed, a promoter induction may alter substantially.
[1] Radeck et al. The Bacillus BioBrick Box: generation and evaluation of essential genetic building blocks for standardized work with Bacillus subtilis, Journal of Biological Engineering, 7:29 2013.
[2] Anderson, J. C. & Team, B. i. Anderson Promoters Colletion,
Protocols - Assembling and Data acquisition
Assembling protocol was followed precisely as described by Brasil-SP team. In summary, all parts from iGEM 2014 Kit were originally in pSB1C3 vector, cloned and transformed into competent E. Coli.
After separating three different subpopulations from three different colonies (i.e., biological and technical triplicates), we have studied how the fluorescence per cell evolved over time. We have used a SpectraMax® M3 (Molecular Devices) plate reader. To prevent cross-talk and light scattering, samples were prepared in a black plate and top read was set to acquire fluorescence measurements. To keep track of cellular growth of each population, we have measured Optical Density (OD) using a clear, round-bottomed, 96-well Greiner plate.
We have used a negative control (E. Coli with with plasmid but without any expression) and a positive control (I20270). We have also used J23101 from Anderson library to use it to normalize our measure with respect to our Interlab Study.
Characterization improvement of pVeg (BBa_K823003) was added to its Experience page