Team:Sydney Australia/Modeling/ElectroStop
ElectroStop
As part of our modelling team's efforts, this year we developed and built a device called ElectroStop (Electrophoresis - Stop). ElectroStop is designed to address a commonly occurring problem in our lab, which is that when running Gel Electrophoresis experiments the amount of time required varies depending upon the sample to be separated and the voltage chosen. Though timer devices which switch off the device after a certain period of activation exist, their use requires prior knowledge of the approximate time necessary for separation.
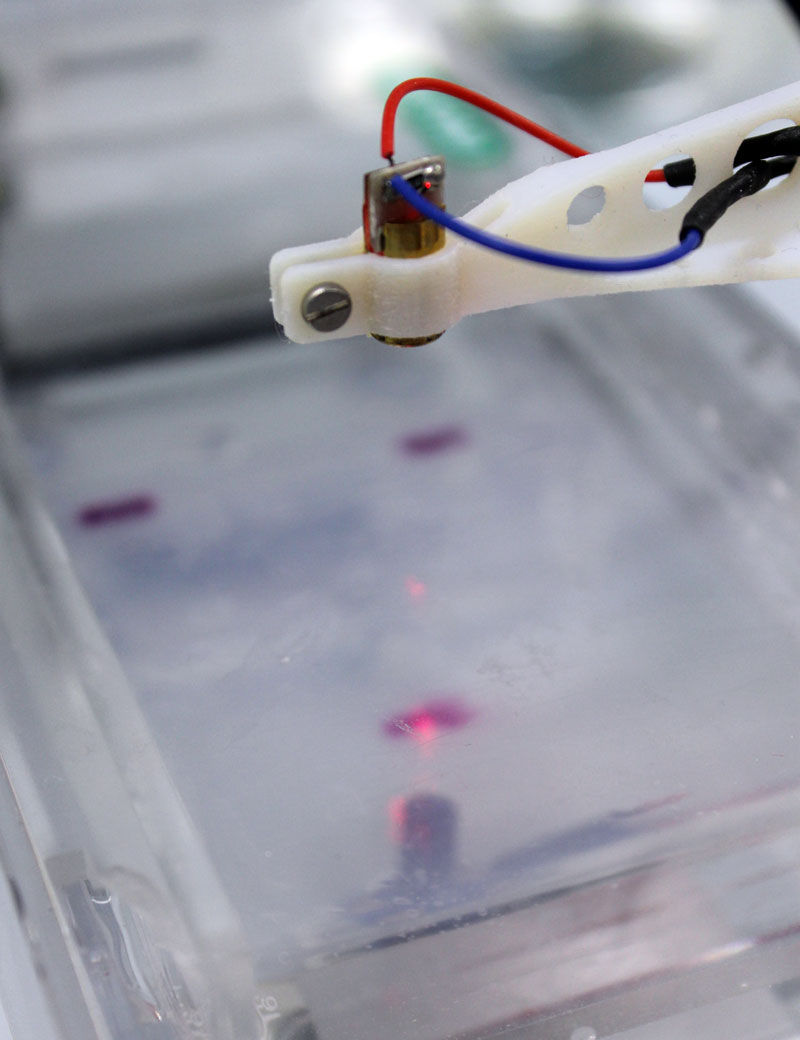
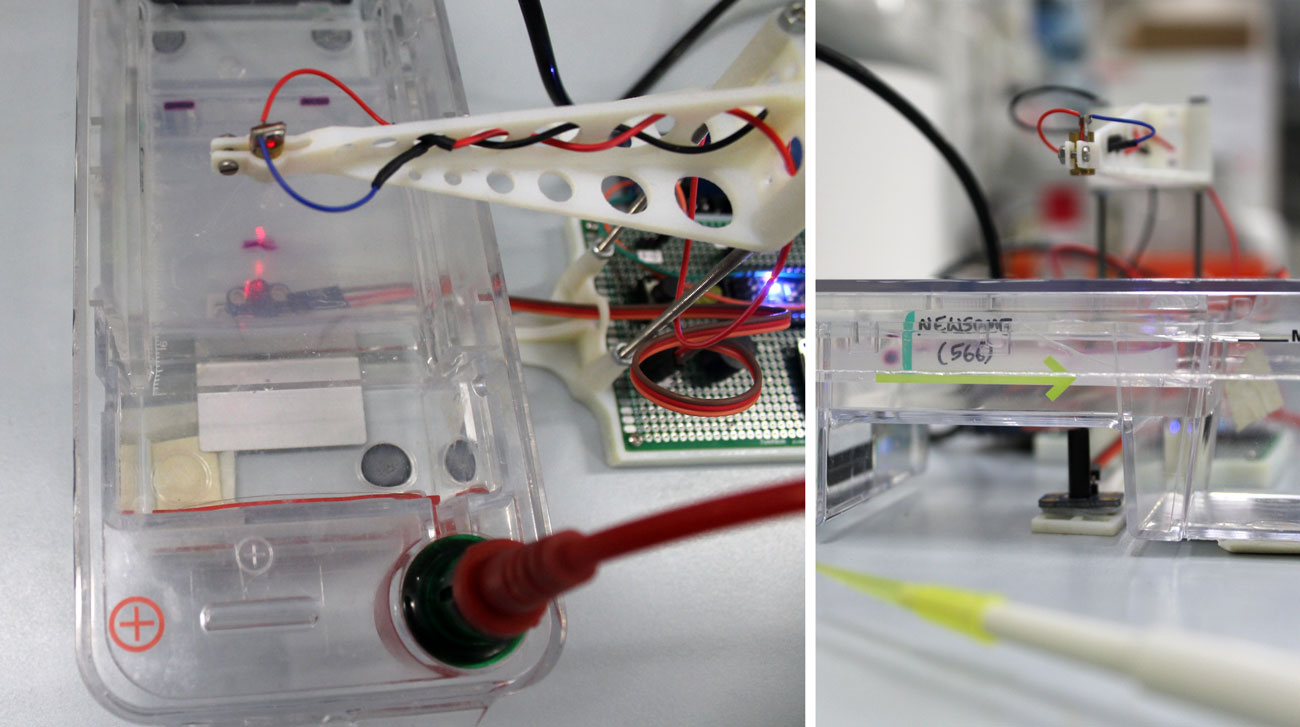
ElectroStop solves this problem by automatically cutting off the power supply once a gel's end is reached. This point is identified by continually passing a laser through one of the gel lanes, and recording the intensity of the emergent beam using a Photoresistor. When one of the marker dye bands reaches the end of the gel it passes through the laser's beam, resulting in a slight decrease in the emergent beam's intensity, which the device then recognizes as the appropriate time to switch off the experiment.
In addition to its practical utility, ElectroStop demonstrates the potential for open-source hardware to be developed in a Synthetic Biological context. In its production we utilised a number of rapid-prototyping approaches and commercial off-the-shelf (COTS) components, which not only reduces cost and complexity, but means that our device can easily be replicated by researchers at any institution.
Electrical Components & Design
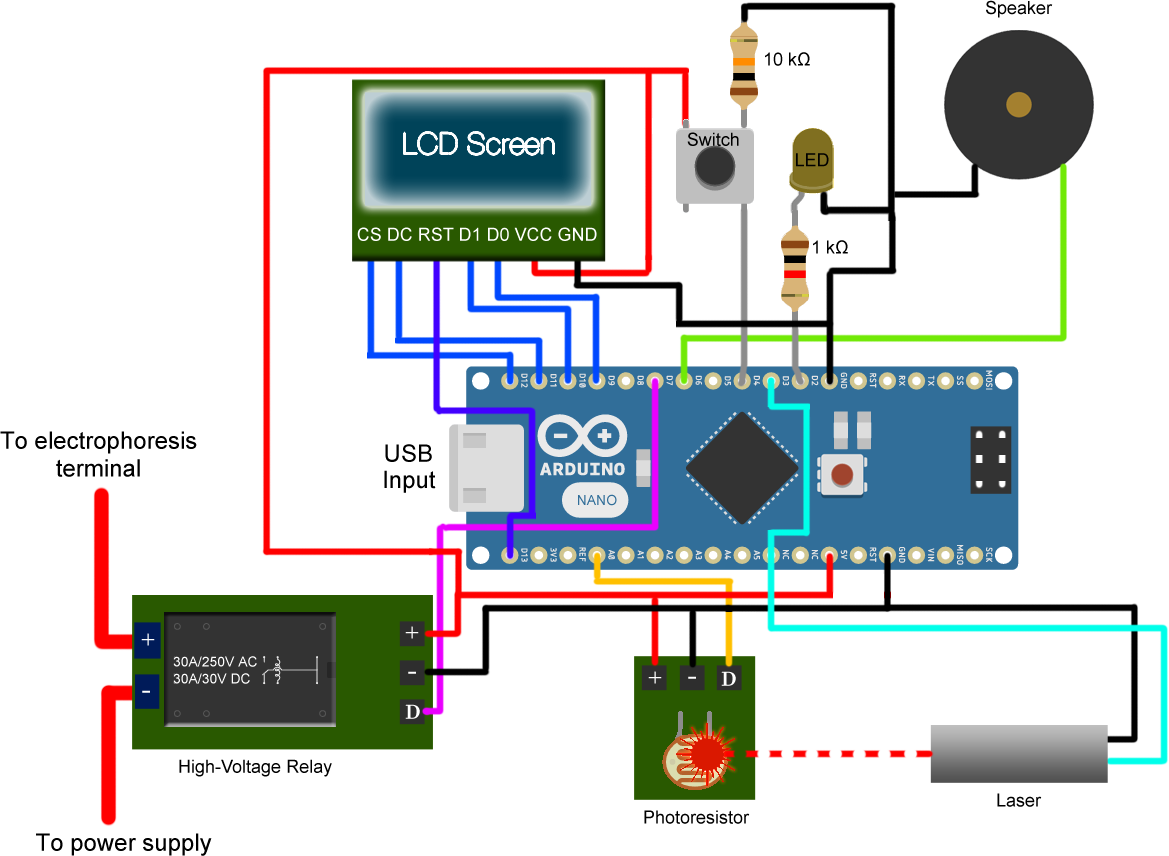
ElectroStop is built around an Arduino Nano micro-controller, through which all circuit components interface (Figure 4). By utilising a COTS central controller we are able to take advantage of extensive experience, both within our team and throughout the Arduino community, to rapidly design and build our device.
Arduino Nano (Arduino Nano v3 w/ ATMega328) - The Arduino Nano provides the "brain" for ElectroStop, and is responsible for controlling all components. It is programmed via micro-USB connection from a computer, which also provides power during the device's operation. Along the Arduino's top and bottom edges are a range of Input/Output pins, which provide electrical signals and power for components (Figure 4).
The 5V and GND (Ground) pins provide a reliable power supply for components. Digital output pins (D2-D13) control the voltage supplied to the high-voltage relay, switch, LED, speaker, and laser by supplying either a high (5V) or low (0V) logical output. It is possible to supply intermediary values (such as the 3.2V supplied to the laser) via pulse width modulation (PWM), which involves rapidly switching the digital pin between high and low states such that the apparent time-average voltage is as desired (for example, to produce 3.2V the pin is switched rapidly, spending 64% in its high state, and 36% in its low state, giving \(0.64\times5+0.36\times0=3.2V\)). Operation of the LCD screen requires more complex interfacing with the Arduino, necessitating use of its serial peripheral interface (SPI) digital pins, which are in this case MOSI (D9), CLK (D10), DC (D11), CS(D12), and Reset (D13). The photoresistor utilises one of the Arduino's analog pins (A0), which is able to record the apparent voltage being supplied to it with reference to ground.
Laser (650nm 3.3V low-power Laser Diode) - In order to improve sensitivity we selected a very low-power laser diode, and using PWM on pin D3 we force it to operate below its recommended voltage. This produces a low-intensity beam, which is easier for gel markers to obstruct, thereby making the device more sensitive (Figure 3).
Photoresistor (EBR00064L Light Dependent Resistor) - To record the emitted laser intensity we utilise a photoresistor, a simple device who's resistance depends on incident light levels. The output from the photoresistor is passed into arduino pin A0, which serves as a 10-bit analog-to-digital converter, returning a number between 0-1023 depending on the measured light intensity. As this measurement can show substantial noise, we acquire each photoresistor reading by taking the average of 100 samples collected over 5 seconds (so, 50ms apart). This produces an output that is less susceptible short-term light-level fluctuations and electronic noise in the device.
High-Voltage Relay (Songle SLA-05VDC-SL-A Large Current Relay Module) - Though the Electrophoresis power supply provides a very small current, it can supply voltages up to 250 V, necessitating a high-voltage relay be utilised for switching. For our device we selected the highest-specification relay that we could reasonably utilise, capable of controlling up to 30 Amps at 250 VAC and 30 Amps at 30 VDC. In reality the supplied electrophoresis power may fall outside of this range (it is closer to 200VDC and 0.1 Amps), which we deemed acceptable due to the very small current being used, though over time this could cause increased wear on the relay's terminals. This is due to large DC voltages being prone to arcing during switching, because unlike AC voltages they do not frequently drop to zero, extinguish any arc. This is why the recommended DC voltage for a mechanical relay is typically lower than the corresponding AC capability.
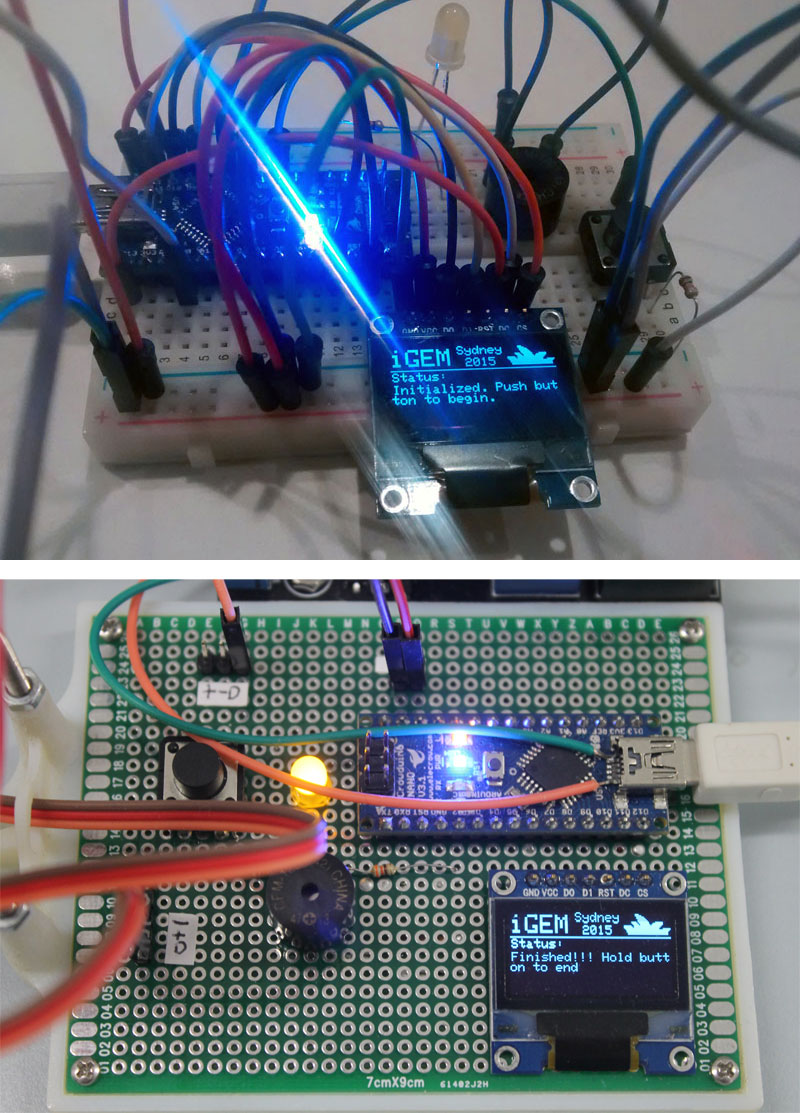
LCD Screen (0.96" Blue/Black OLED 128x64) - In order to display the status of the device (Figure 6), ElectroStop employs a very small 128 by 64 pixel OLED screen. This communicates with the Arduino via SPI, and utilises the Adafruit SSD1306 and GFX libraries to assist in displaying objects and text on the screen.
Switch (Push-button w/ 10 k\(\Omega\) pull-down resistor) - User command of ElectroStop is done via a single switch, connected to ground via a 10 k\(\Omega\) pull-down resistor, which when pressed tells the device to move between modes.
LED (Yellow w/ 1 k\(\Omega\) resistor) - An indicator LED is included (connected via a 1 k\(\Omega\) resistor) to attract the user's attention, which flashes once the device senses that the electrophoresis is complete.
Speaker (8-Ohm piezo buzzer) - A small piezo buzzer, which outputs two tones once electrophoresis is complete, is also included to attract the user's attention.
After prototyping and testing this circuit, the components were soldered to a ProtoBoard (Figure 2). Pins were installed such that the laser, photoresistor, and relay can be easily detached, as we may want to deconstruct the device during transport, or replace components with different variants in the future.
Software
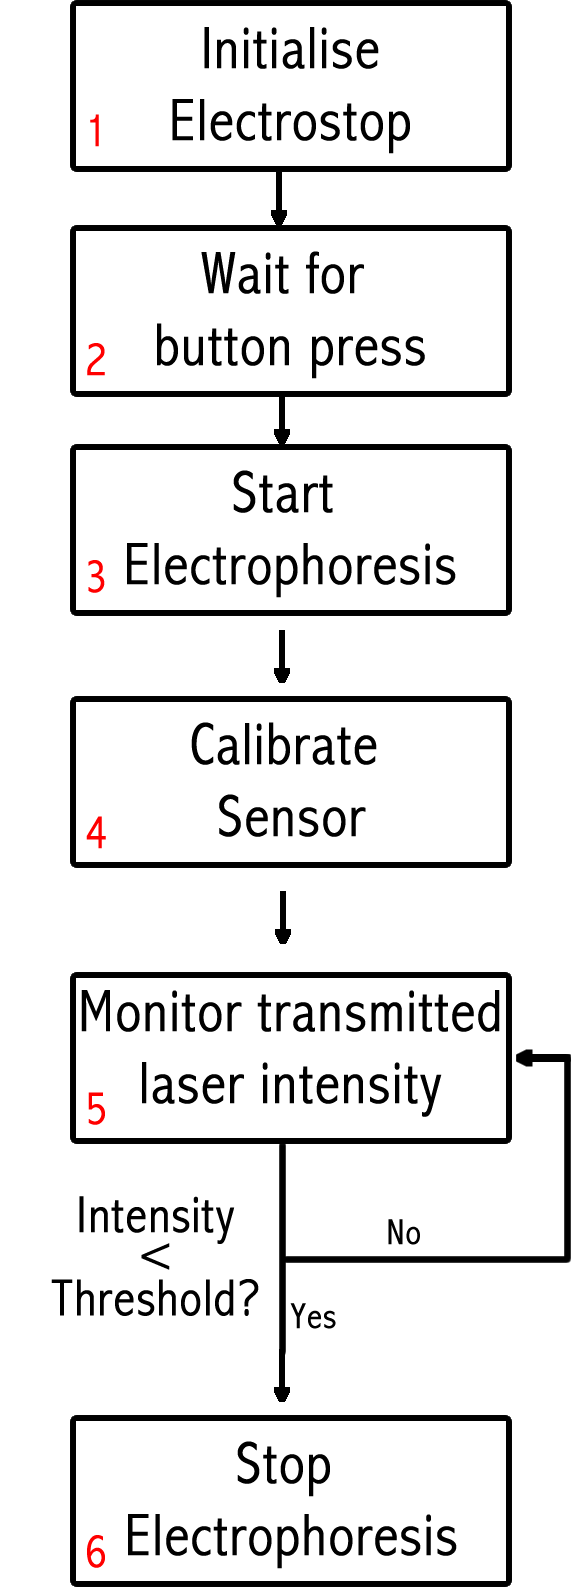
ElectroStop's software is written in the Arduino programming language, an implementation of Wiring, which allows us to take advantage of existing libraries that control components such as the LCD. The complete code is available on the Supplementary Material page. The software defines the device's sequential operational modes, as described in Figure 5.
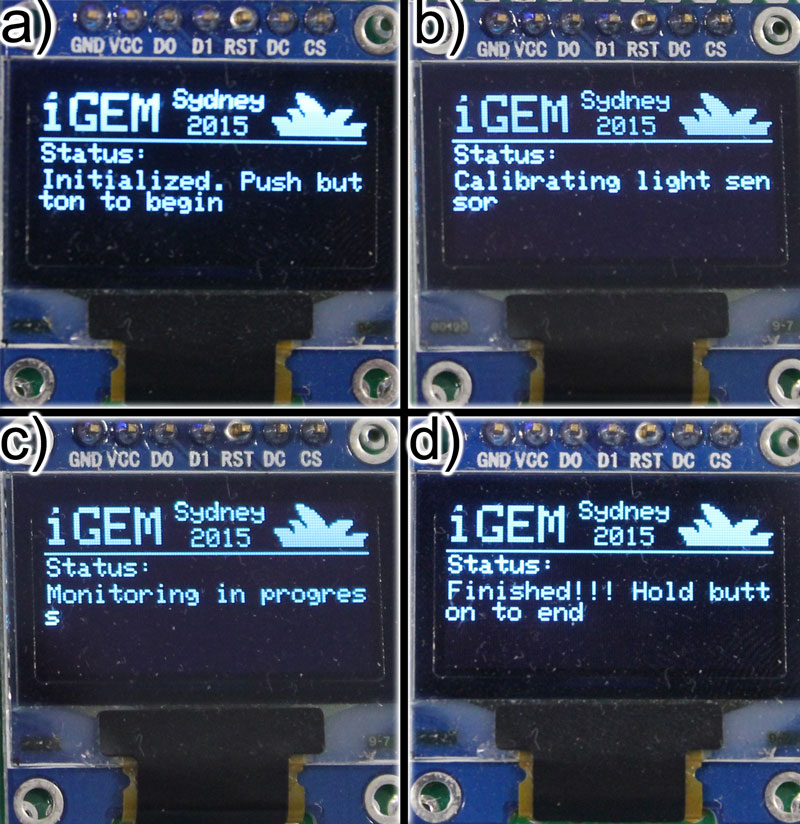
1 - Initialisation - When ElectroStop is powered on it first goes through its initialisation mode. This sets the initial pin voltages, ensures the high-voltage relay is switched off, turns the laser on, and boots up the LCD screen to display an initialization message. The device then moves into a waiting loop. At this stage the LCD displays the message in Figure 6 a.
2 - Waiting for button press - Once initialised, ElectroStop monitors the digital input pin from the button (D4), waiting for the user to press it. Once pressed, ElectroStop begins the electrophoresis experiment.
3 - Start Electrophoresis - As the user has indicated the experiment should start, the high-voltage relay is now switched on, and the experiment begins. This is done before calibrating the photoresistor sensor, as the act of switching the relay on may slightly change the power supplied to other components, which could affect the photoresistor's reading slightly.
4 - Calibrate Sensor - ElectroStop takes a reading from the photoresistor, averaged over five seconds, which is then set as the threshold value used to define the light intensity expected during the experiment. This must be done each time the device is run since the ambient light conditions may change, thereby affecting what a "normal" intensity registered by the sensor may be. At this stage the LCD displays the message in Figure 6 b.
5 - Monitor Laser Intensity - As the experiment is now calibrated and underway, ElectroStop begins to monitor the transmitted laser intensity. The device is designed such that this intensity should stay fairly constant until a marker dye reaches the end of the experiment, at which point it will pass through the laser, obstructing it slightly. This will result in a decrease in the laser's intensity as measured by the photoresistor. To determine when this has occurred every five seconds a reading is compared to the threshold value recorded in calibration: If this reading has decreased to some set distance below the threshold value, the experiment stops. If not, monitoring continues. At this stage the LCD displays the message in Figure 6 c.
6 - Stop Electrophoresis - Recognising that the dye marker has reached the end of the electrophoresis tray, ElectroStop brings the experiment to a halt: The laser and high-voltage relay are switched off. At this stage the LCD displays the message in Figure 6 d.
Structure
To form ElectroStop's structure we utilised the Sydney Invention Studio's Stratasys Objet24 3D printer. This device is able to print using strong VeroWhite plastic to sub-millimeter accuracy, making it ideal for our needs.
In designing ElectroStop's structure we wanted to build something that was not only functional, but cost effective as well. This necessitated a sparse structure, which would utilise minimal plastic during printing and hence minimise cost. Aside from this the design requirements were simple: The structure must be able to secure the central circuit board, high-voltage relay, and photoresistor on a flat surface, whilst holding the laser some distance above the photoresistor. As different electrophoresis trays are frequently used in our lab, it was desirable that the distance from laser to photoresistor be easily adjustable.
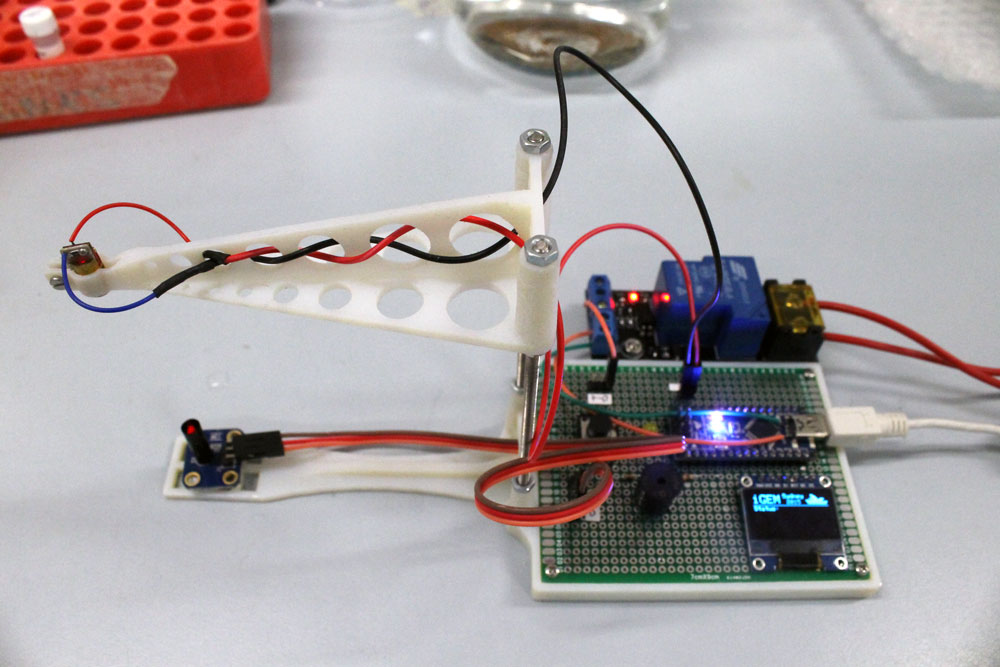
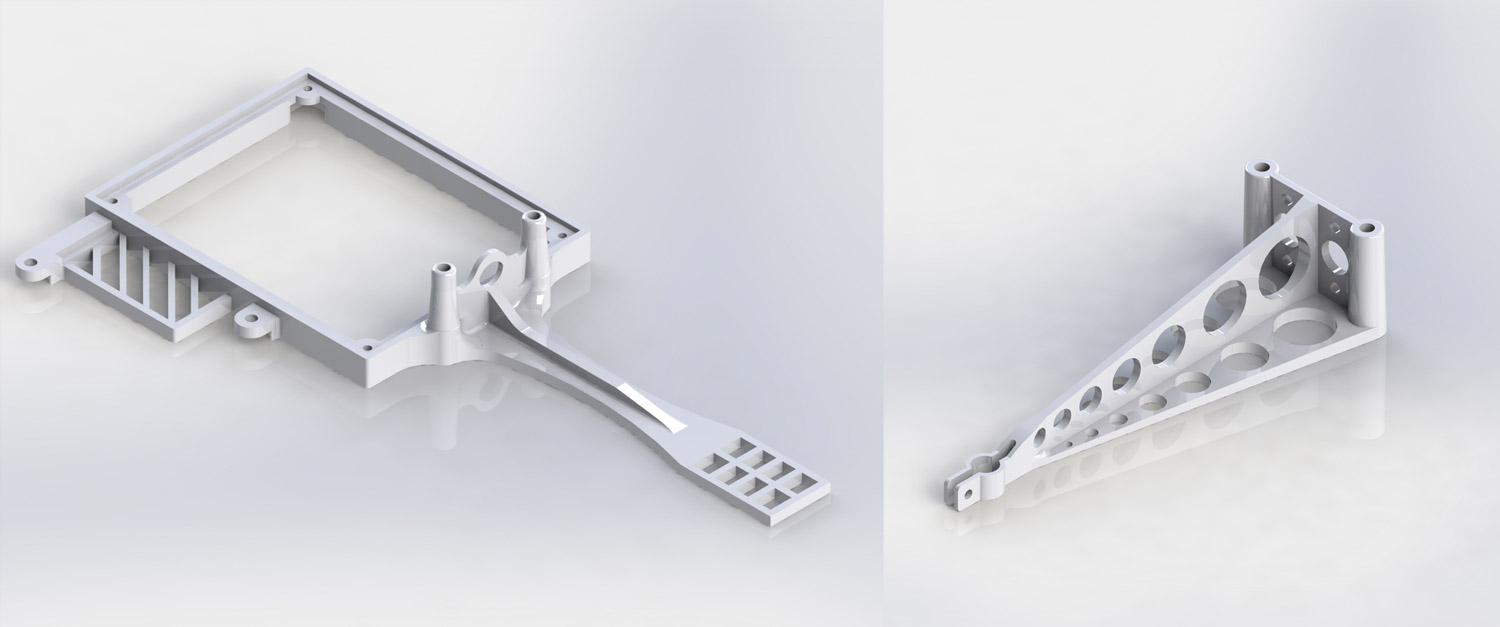
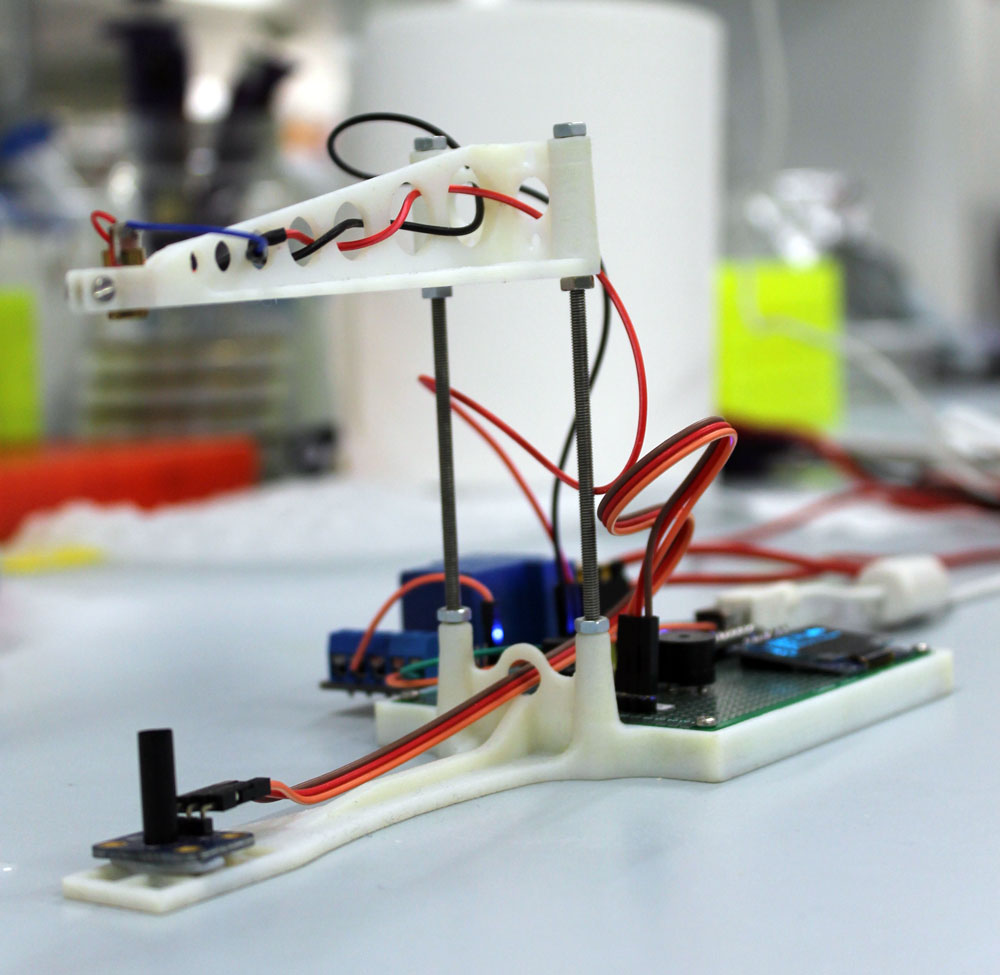
With these design requirements in mind we developed the two-piece structure demonstrated in Figure 7 using Solidworks. The base section (Figure 7 left) is made to snugly fit the main circuit board, and holds the high-voltage relay (in the bottom left corner) and the photoresistor (on the "fly-swatter" in the bottom right). Though the circuit board and relay are held in place using nuts and bolts, we secure the photoresistor less securely (as in Figure 9, with blu-tack!) such that it can be aligned with the laser beam. The upper part of the structure (Figure 7 right) holds the laser diode (Figure 3), and makes use of a sparse construction that saves weight whilst maintaining rigidity.
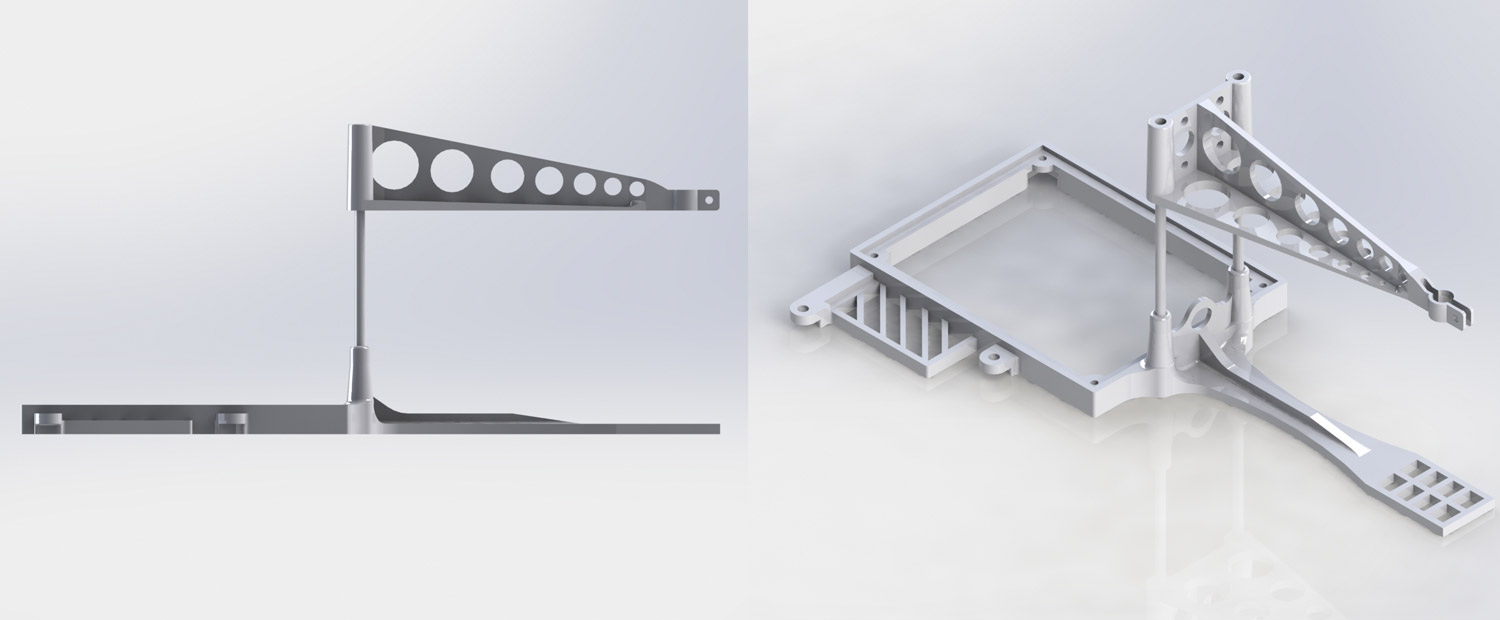
The structural pieces are connected using two M3 threaded rods (Figure 8), which can be adjusted vertically via the positioning of nuts which sit flush against the plastic supports. This allows the upper structural section to be raised or lowered to anywhere between 5 and 20 cm above the lower surface, such that it to accommodate many common electrophoresis trays.
The final 3D printed structure is pictured in Figure 9, demonstrating the interplay of different structural members. Here the threaded rods which connect the two components are visible, along with the nuts used for adjustment of the laser / photoresistor separation to accommodate different electrophoresis setups.
Testing & Results
The first validation test for ElectroStop involved assessing the measured decrease in laser intensity due to different marker dyes at different concentrations. As some colours will more strongly block the red laser, we wanted to assess which dyes would be appropriate for use with the device.
It was found that ElectroStop was able to register the presence of all dyes (when they cross its path) when applied in medium to high concentrations. In low concentrations (which can render a marker difficult to see even with the human eye), the sensitivity of the photoresistor was found to be insufficient, and no noticeable decrease in the laser intensity was recorded. That said, some dyes provided a greater decrease in laser intensity than others, with the purple dye commonly used in our laboratory (New England Biolabs Gel loading dye 6X as in Figure 10) showing the best results.
Having tested the ability of different dyes to obstruct the laser's path, we were able to define (in ElectroStop's software) the measured drop (below threshold) in laser intensity necessary to indicate a dye band had reached the end of the experiment. For example, for the purple dye pictured a normal calibrated laser intensity of 900 was measured, which when obstructed by the dye in medium concentration dropped to 750, so we set an intensity drop of 100 from the calibrated threshold (900) as the point at which the experiment cuts off. From here we were able to test ElectroStop fully, finding that it functioned as intended. During an experiment the circuit was able to cycle through different operational modes as intended (shown in Figure 6), with the high-voltage switch cutting the electrophoresis power once the experiment was complete.
Improvements and Future Work
Though ElectroStop achieved the purpose for which it was designed, a number of obvious improvements could be made to the device in the future.
At present the device's main circuit is not very well protected, from both mechanical damage or chemical contamination. There is always potential for spills and dropped items in Synthetic Biological labs, so 3D printing a structure which shields most of the circuit could provide protection. This was not pursued in our initial design due to the cost of 3D printing, but could easily be included in the future.
Though it is possible to tailor ElectroStop's sensitivity to better recognise different dyes, at present this requires a computer be connected to re-program the device. In the future, should the device be used frequently with different marker dyes, it would therefore be useful to add additional operational modes which allow the user to adjust the photoresistor's threshold and sensitivity.
Finally, major improvement to the device's longevity could be achieved by replacing the mechanical high-voltage switch with a solid-state power transistor. This would be more appropriate for switching of DC current, and due to its lack of moving parts might yield a longer lifespan. Transistors are generally favourable for the switching of DC current, as they do not benefit from the regular zero crossing of AC current in the same way that mechanical switches do. We elected not to include a power transistor in the design for ElectroStop presented herein as we were unable to find an appropriately easily-integrateable component board.

