Team:Brasil-USP/Modeling/Optimizations
BioInformatics
Modeling


Table of contents
We have developed several libraries in Python and a comprehensive guide through our material and code. Our main idea is to spread further several techniques on modeling and simulations for synthetic biology. Everything is hosted on GitHub and publicly available for anyone in the world. We really tried to close the gap between modeling and experimentation as much as possible. For instance, the software we developed was used to analyze our Interlab Study and all results from the wet lab.
This material will be continuously be available and in the following we will go through some of what we have developed.
Crash-course on Python
The first thing we did was to level-up everyone interested with modeling, and created a small material that can be used to quickly understand how to use python and get ready for real-world problems as soon as possible. For instance, here we have a step-by-step tutorial on how to install Python with Anaconda, and here the course itself.
This material was used with UFSCar-Brasil team during our collaboration day of modeling (described here).
Numerical techniques
Numerical methods are always a problems when someone from a biological area wants to simulate something. For several applications, there are 3rd party software that can very well simulate your system. But sometimes you may want to do it yourself. For this reason, we created another complementary material (available here) that demonstrates how to use state-of-art numerical methods to simulate differential equations and plot them. These techniques cover most of the simulation issues people have during their first trials.
Data fitting and analysis
The last complementary material (available here) was focused on analyzing and fitting data. To use as an example, we have used real data available from one of Mozilla's Software Carpentry courses.

Figure 1: Interlab devices 1, 2 and 3, in order from top to down.
96-well Plate Analyzer
One of the main problems with data analysis in some biological areas is to deal with 96-well plates: you usually create a map where your samples are and then have to aggregate appropriately your data to construct averages and plot figures. The problem scales exponentially when you have measures over time. To deal with this problem we developed a series of functions in Python to aggregate the data and work on it with minimal effort.
For instance, see below how we read our data and then print the three first hours of measure of wells containing only LB.

Figure 2- Example of our Python functions to read data from 96-well plates and then process it quickly.
All of our results were analyzed using these routines. For instance, you can find all calculations from our Interlab Study available here. Also, it is pretty easy to export your data in a readable format.
This approach not only helps with sharing the data, but also improves reproducibility: anyone can run reproduce from scratch everything we did.
Statistical tests
Finally, often it is not enough to graphically show that one sample is bigger than another: sometimes you need to show quantitatively that the differences seen in a graph are statistically relevant. For this purpose there are statistical tests that can be performed in your data.
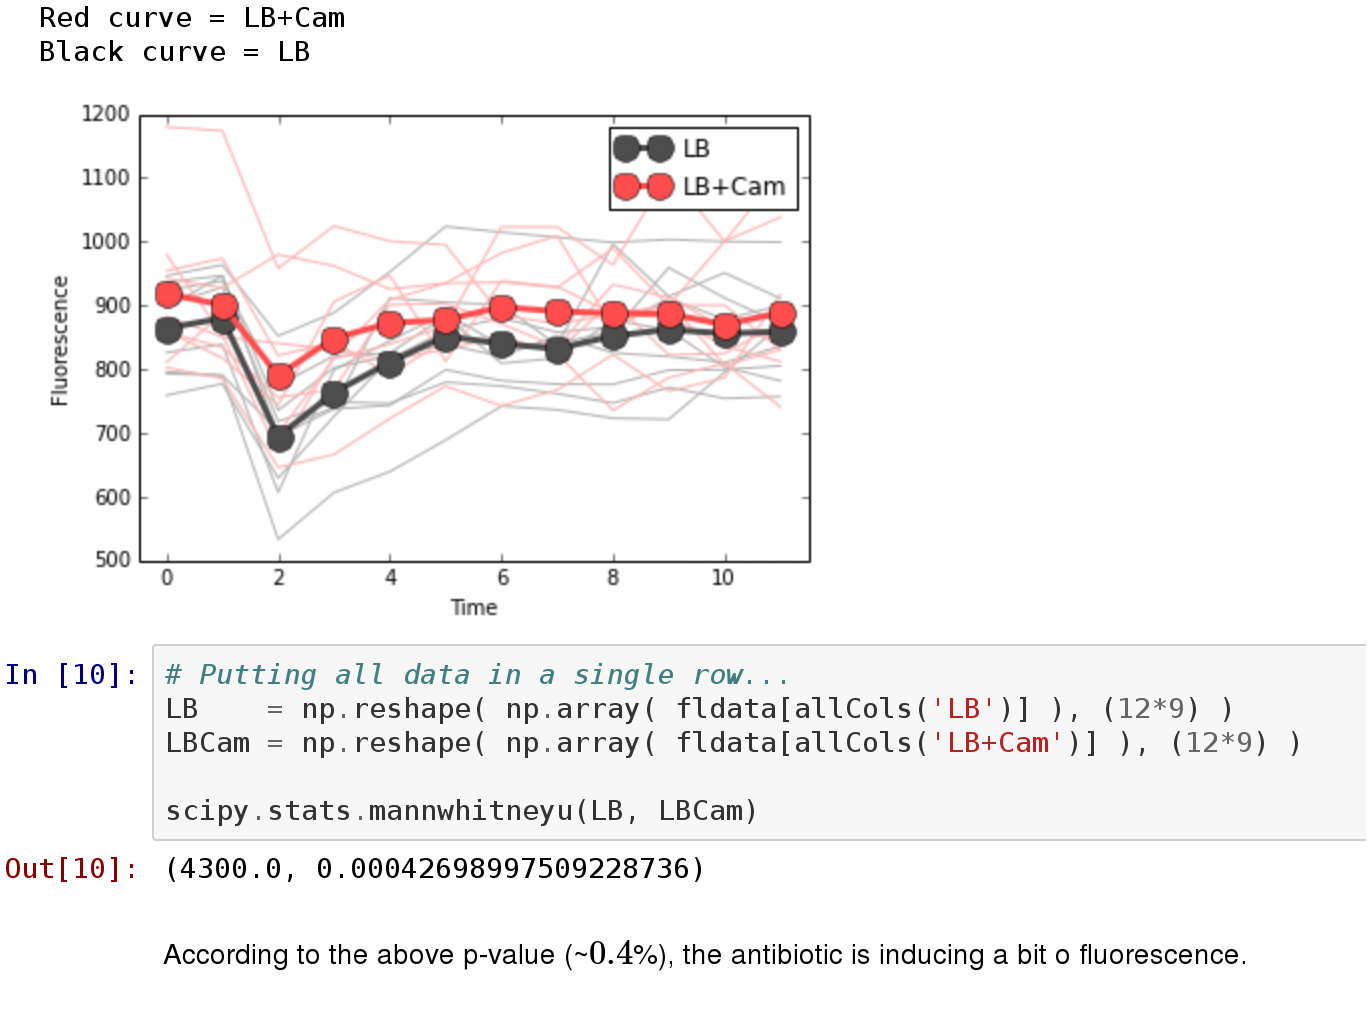
Figure 3- Example of our Python libraries for evaluating statistical tests.
With our libraries, you can perform this tests easily, as shown above. We have extensively used in our project Mann-Whitney U test and Student's T.