Difference between revisions of "Team:Czech Republic/Microfluidics"
(→Abstract) |
(→Yeast induced blood agglutination on-chip) |
||
| (20 intermediate revisions by the same user not shown) | |||
| Line 2: | Line 2: | ||
<html><div class="info-box"><div class="left"></html> | <html><div class="info-box"><div class="left"></html> | ||
== Abstract == | == Abstract == | ||
| − | Microfluidic devices were designed and fabricated to characterize the signal transmission in the developed IOD band system. | + | Microfluidic devices were designed and fabricated to characterize the signal transmission in the developed IOD band system. The signal transmission was characterized using spatially separated cell cultures inside a single microfluidic channel in conjunction with live fluorescence microscopy. Plasmids coding for a synthetic reporter protein were transformed into signal-receiving cells to show activation of its yeast pheromone pathway. The on-chip characterization was used to evaluate the signal transmission range and its evolution in time. In addition, special microfluidic topologies were designed and fabricated to test yeast-induced agglutination on-chip to lower the time and sample volume requirements. Agglutination tests were performed with synthetic yeast strains inducing blood agglutination by displaying the human antigen A antibody (anti-HuA) on its surface. The yeast strains were designed and synthesised by [[Team:Czech_Republic/Project/Location_tags |Module 3]]. The amount of blood required for the experiment was approximately 5 μl. The overall experiment duration did not exceed 60 seconds. |
<html></div><div class="right"></html> | <html></div><div class="right"></html> | ||
| Line 9: | Line 9: | ||
* Characterization of signal transmission range between wildtype MATa and MATx ''Saccharomyces cerevisiae'' cells. | * Characterization of signal transmission range between wildtype MATa and MATx ''Saccharomyces cerevisiae'' cells. | ||
* Dynamic characterisation of signal transmission between synthetic MATa and MATx ''Saccharomyces cerevisiae'' cells. | * Dynamic characterisation of signal transmission between synthetic MATa and MATx ''Saccharomyces cerevisiae'' cells. | ||
| − | + | * Demonstrated yeast induced blood agglutination on-chip by human antigen A antibody (anti-HuA) displayed on cell surface by Yeast Surface Display. | |
| − | * Demonstrated yeast induced blood agglutination on-chip by human antigen A displayed on cell surface by Yeast Surface Display. | + | |
<html></div><div class="break"></div></div></html> | <html></div><div class="break"></div></div></html> | ||
= Introduction = | = Introduction = | ||
| − | The diffusion processes are slow, and the inertial effects are negligible on micro-scale with low Reynolds number {{:Team:Czech_Republic/Template:ReferenceRef|Angelescu2011}}. Hence microfluidics enables complex control of the intercellular microenvironment. Microfluidic experiments in conjunction with live fluorescence microscopy were designed and performed to verify and characterize the signal transmission mechanism in the developed IOD band system. | + | The diffusion processes are slow, and the inertial effects are negligible on micro-scale with low Reynolds number {{:Team:Czech_Republic/Template:ReferenceRef|Angelescu2011}}. Hence microfluidics enables complex control of the intercellular microenvironment. Microfluidic experiments in conjunction with live fluorescence microscopy were designed and performed to verify and characterize the signal transmission mechanism in the developed IOD band system, and to verify the developed yeast-induced blood agglutination mechanism. |
= Soft-lithography = | = Soft-lithography = | ||
| Line 39: | Line 38: | ||
[[File:Microfluidics_experimental_setup.jpg|thumbnail|Experimental setup]] | [[File:Microfluidics_experimental_setup.jpg|thumbnail|Experimental setup]] | ||
| − | Microfluidic experiments were conducted on a platform already established by the Georgiev lab. The laboratory is equipped with a precise microfluidic syringe system (neMESYS Low Pressure Syringe Pumps) and a microscopic station enabling fluorescence imaging and live cell microscopy (Olympus IX83, CellSens software). | + | Microfluidic experiments were conducted on a platform already established by the [http://ccy.zcu.cz/ Georgiev lab]. The laboratory is equipped with a precise microfluidic syringe system (neMESYS Low Pressure Syringe Pumps) and a microscopic station enabling fluorescence imaging and live cell microscopy (Olympus IX83, CellSens software). |
= Microfluidic experiments = | = Microfluidic experiments = | ||
| Line 47: | Line 46: | ||
[[File:Filling.jpg|thumbnail|Example filling of microfluidic channel.]] | [[File:Filling.jpg|thumbnail|Example filling of microfluidic channel.]] | ||
| − | + | Microfluidic devices were designed and fabricated to characterize the signal transmission in the developed IOD band system. The signal transmission was characterized using spatially separated cell cultures inside a single microfluidic channel in conjunction with live fluorescence microscopy by characterisation of the yeast pheromone pathway activation. Fluorescent reporter proteins were connected to specific functional products to show activation of the yeast pheromone pathway. Details on the synthesis and function of the used reporter plasmids are provided by [[Team:Czech_Republic/Project/Signal_transduction|Module 1]]. Synthesized reporter plasmids were transformed into specific yeast strains to enable characterization of the signal transmission between yeast cells using set of orthogonal signals designed and synthesized by [[Team:Czech_Republic/Project/Synthetic_signals_and_receptors |Module 2]]. | |
| − | + | [[File:GFP_Gradient_Static.jpg|900px|thumb|center|caption|Fluorescence microscopy image showing activation gradient of MATa cells yeast pheromone pathway with pFUS1 reporter by MATa cells producing synthetic alpha factor in the microfluidics.]] | |
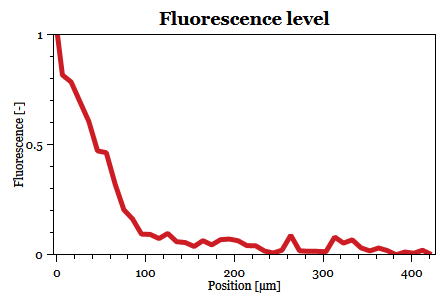
| − | [[File: | + | [[File:MATa_MATx_GFP_Gradient.png|thumbnail|right|Level of fluorescence and its dependence on the distance from transmitting cells. Performed on ''Saccharomyces cerevisiae'' wildtype pheromone signaling molecules and receptors.]] |
| − | + | Simple microfluidic devices with T-shaped microchannels were used to characterise the signal transmission between selected yeast strains. Two cell types were selected for each experiment. One cell type transmits the signal in the form of pheromone molecules. Cell with complementary receptors produce the green fluorescent protein (GFP) if the pheromone level reaches certain activation threshold. The individual cell types are introduced to the microfluidic device in parallel through separated inlets. Due to the laminar nature of the flow, the individual cell types remain spatially separated inside the microfluidic device for the whole experiment. The flow is stopped when the microfluidic device is filled with cells. The rest of the experiment is performed statically. Time-lapse fluorescence microscopy is used to dynamically measure levels of GFP expression in the cells that receive the signal. | |
| − | + | Signal transmission between Wildtype MATx <html><span style="color:#CC1D24;">↝</span></html> MATa: STE2 receptor from ''Sacharomyces cerevisiae'', and between synthetic MATa expressing ''Saccharomyces cerevisiae'' alpha-factor; \(\Delta\)Bar <html><span style="color:#CC1D24;">↝</span></html> MATa: STE2 receptor from ''Saccharomyces cerevisiae'' was characterised. As a negative control, signal transmission between MATa expressing "Candida parapsilosis" alpha-factor; \(\Delta\)Bar <html><span style="color:#CC1D24;">↝</span></html> MATa: STE2 receptor from ''Sacharomyces cerevisiae'' was studied. No significant level of fluorescence was observed suggesting these signals being orthogonal. The results show that the signal transmission range in saturated culture is approximately 100 μm. | |
| − | + | ||
| − | + | ||
| − | + | ||
| − | + | == Yeast induced blood agglutination on-chip == | |
| − | [[File: | + | [[File:Czech_Republic_AgglutinationChip.png|thumbnail|Illustration of microfluidic chip used for yeast-induced blood agglutination. No sophisticated mixing topologies were required due to the presence of the 100 μm wide channel ease. The eventual cell aggregates were observed in the subsequent chamber.]] |
| − | + | ||
| − | + | Standard agglutination tests are time consuming and require specialized equipment occupying large bench space {{:Team:Czech_Republic/Template:ReferenceRef|Choi2009}}. Special microfluidic topologies were designed and fabricated to test yeast-induced agglutination on-chip to lower the time and sample volume requirements. Prior to the experiment, the synthetic yeast cells were perfused and dissolved in plasma, which is the natural medium for the IOD band diagnostic. Blood sample and yeast culture were introduced to the microfluidic chip through separate inlets, and were brought to contact in the chip. During the experiment, the flow was reversed few times to provide sufficient time for the cells to form the eventual cell aggregates, and to decrease the required sample volume. The overall experiment duration did not exceed 60 seconds. The amount of blood necessary for the experiment was approximately 5 μl. | |
| − | cells. | + | |
| − | + | ||
| − | + | ||
| − | + | Functioning of location tags was proven by cell clumping consistently observed in mixed samples of yeast cells with the anti-HuA location tag and red blood cells from a type A donor. The control samples, where anti-HuA location tag display was not induced, showed negligible aggregation. The experiments also prove the compatibility of yeast cells with blood samples as no significant clumping or other abnormalities that would indicate overall concept infeasibility were observed in control samples. | |
<html> | <html> | ||
Latest revision as of 03:07, 19 September 2015
Microfluidics
Contents
Abstract
Microfluidic devices were designed and fabricated to characterize the signal transmission in the developed IOD band system. The signal transmission was characterized using spatially separated cell cultures inside a single microfluidic channel in conjunction with live fluorescence microscopy. Plasmids coding for a synthetic reporter protein were transformed into signal-receiving cells to show activation of its yeast pheromone pathway. The on-chip characterization was used to evaluate the signal transmission range and its evolution in time. In addition, special microfluidic topologies were designed and fabricated to test yeast-induced agglutination on-chip to lower the time and sample volume requirements. Agglutination tests were performed with synthetic yeast strains inducing blood agglutination by displaying the human antigen A antibody (anti-HuA) on its surface. The yeast strains were designed and synthesised by Module 3. The amount of blood required for the experiment was approximately 5 μl. The overall experiment duration did not exceed 60 seconds.
Key Achievements
- Set of microfluidic devices fabricated by PDMS soft-lithography.
- Characterization of signal transmission range between wildtype MATa and MATx Saccharomyces cerevisiae cells.
- Dynamic characterisation of signal transmission between synthetic MATa and MATx Saccharomyces cerevisiae cells.
- Demonstrated yeast induced blood agglutination on-chip by human antigen A antibody (anti-HuA) displayed on cell surface by Yeast Surface Display.
Introduction
The diffusion processes are slow, and the inertial effects are negligible on micro-scale with low Reynolds number [Angelescu2011]. Hence microfluidics enables complex control of the intercellular microenvironment. Microfluidic experiments in conjunction with live fluorescence microscopy were designed and performed to verify and characterize the signal transmission mechanism in the developed IOD band system, and to verify the developed yeast-induced blood agglutination mechanism.
Soft-lithography
Microfluidic channels were formed using PDMS soft-lithography technology, which has proven biocompatible and readily applicable to available laminar flow cabinets [Fikar2015]. Photomask and silicon master fabrication was outsourced. Fabrication of microfluidic devices was divided into two subsequent steps. In the first step, silicon masters were used for the PDMS molding. In the second step, PDMS molds were bonded to the glass substrates to form encapsulated microfluidic devices using air plasma technology.
PDMS molding
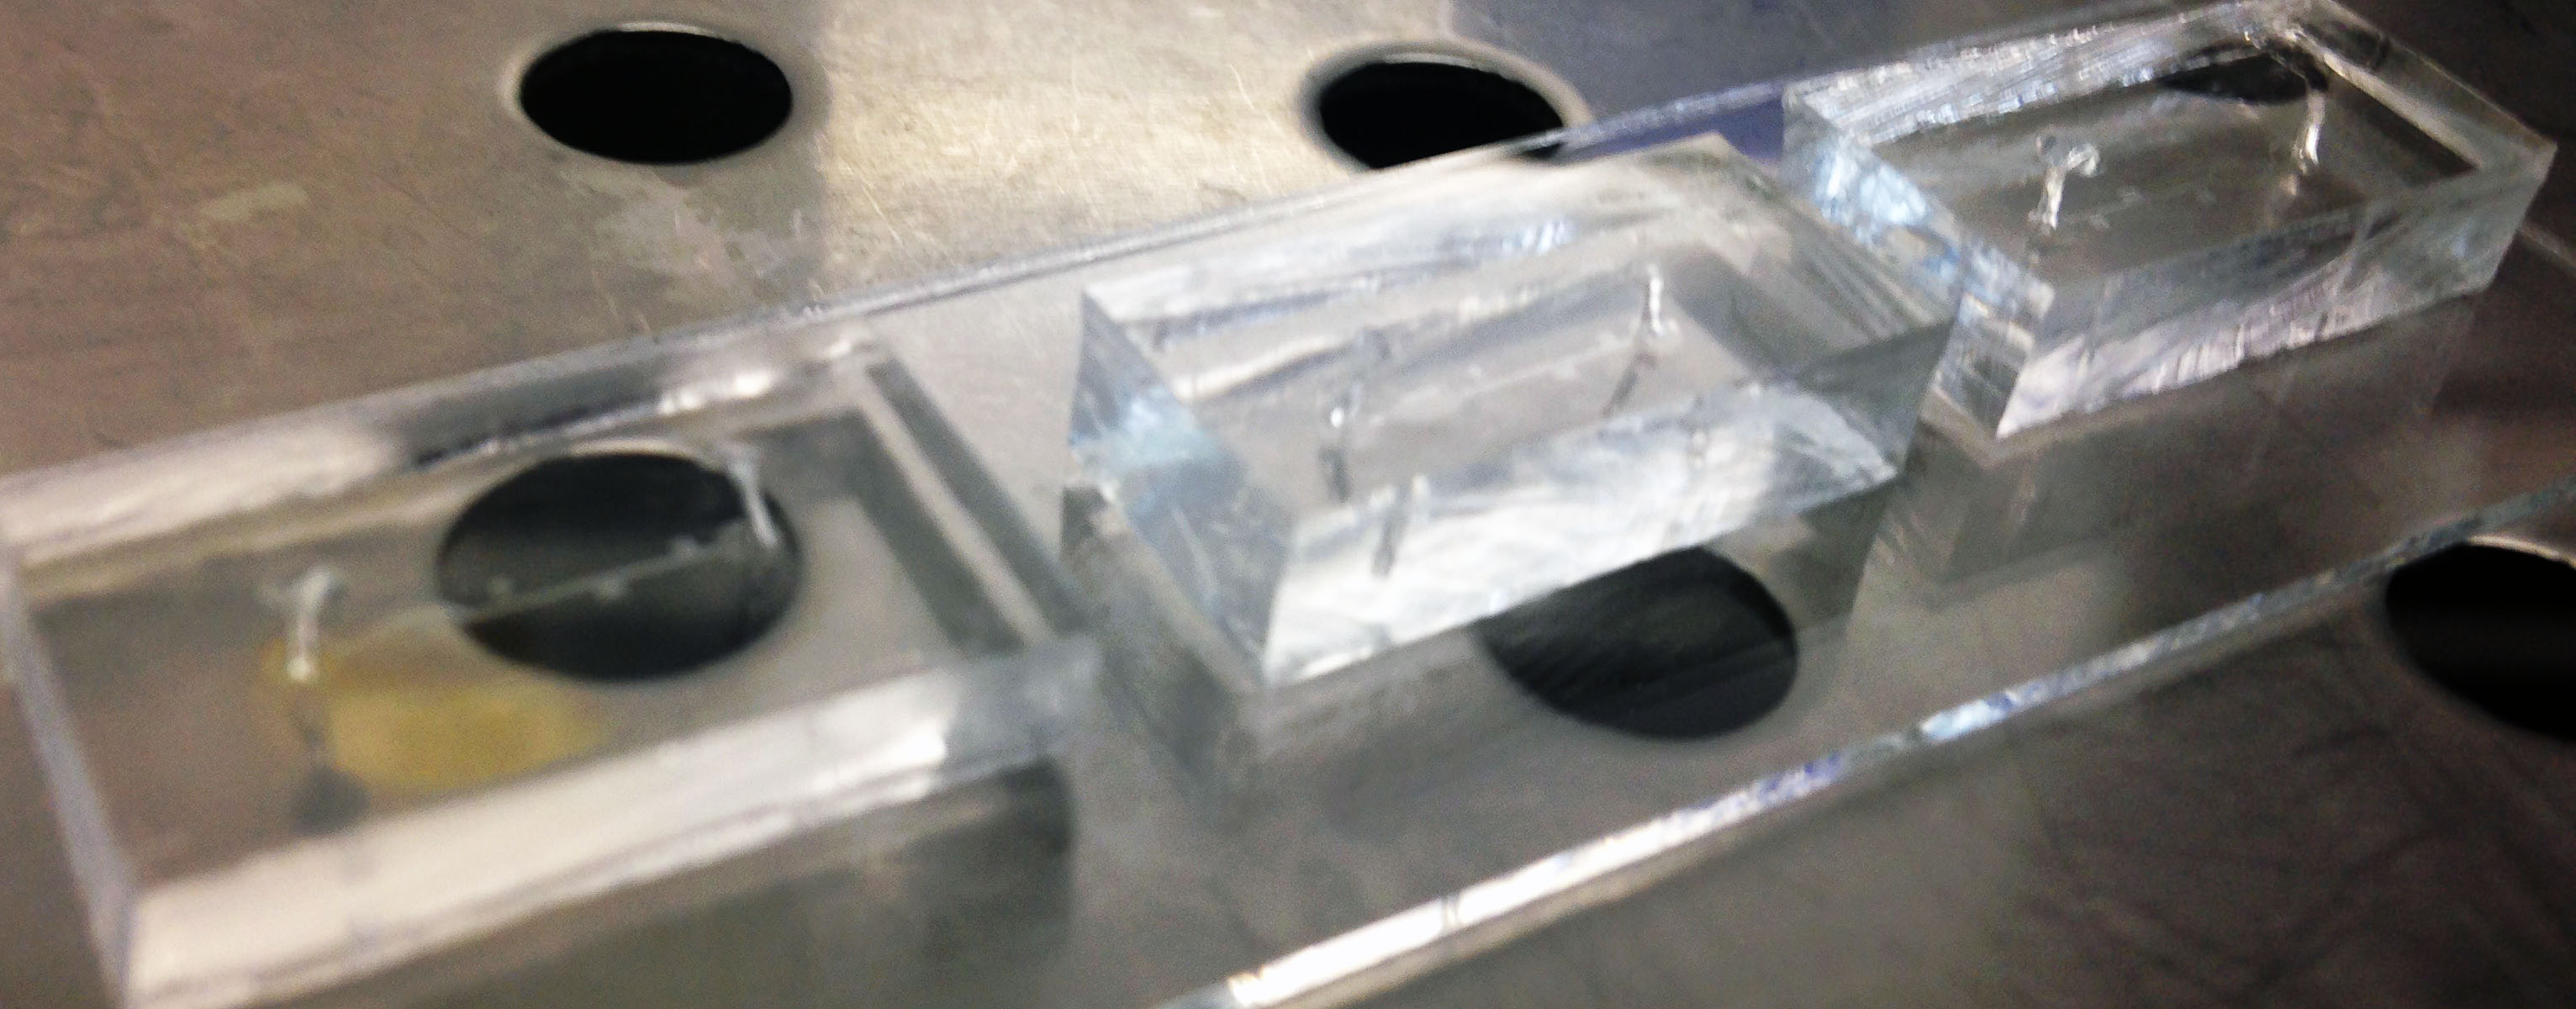
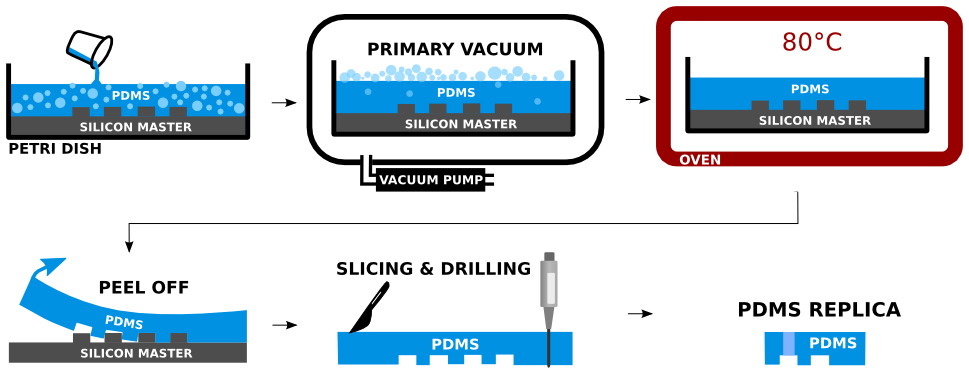
Two-part silicone elastomer Sylgard 184 was used to produce PDMS. The base part was mixed with sufficient amount of curing agent (10:1 ratio). The mixture was centrifuged to remove air bubbles introduced by the mixing. The silicon master was placed in an aluminum foil container and the mixture was poured over. The remaining air bubbles were removed from the PDMS by the sharp tip of a needle. The poured PDMS was maintained in a perfectly horizontal position to assure good planarity and was cured in an oven for 2 hours at 80°C. The PDMS edges were cut off with a sharp tool and the PDMS was peeled off of the silicon master. The PDMS mold was sliced into sections containing individual devices. Inlets and outlets were drilled carefully by biopsy punch of the appropriate diameter at the desired locations of the PDMS replica. Detailed experimental protocol is provided here.
Bonding of PDMS to the glass substrate
Prepared PDMS replicas with imprinted microstructures were cleaned properly with a scotch tape. The PDMS and glass substrate were treated by air plasma for 2.5 minutes. The air plasma affects the PDMS backbone and forms reactive silanol functional groups (Si-OH) enabling formation of permanent irreversible covalent bond of the PDMS to the glass substrate [Wong2009]. In addition, the PDMS treatment with air plasma is beneficial as it avoids non-specific adsorption, decreases cell clogging, and turns the PDMS hydrophilic. The hydrophilicity of PDMS facilitates the future microchannel wetting [Kalio2006]. Immediately after the air plasma treatment, the glass substrate was brought into contact with the PDMS replica and placed in the oven for 5 minutes at 80°C. The bonded devices were stored at room temperature. Inlets and outlets were sealed with scotch tape to avoid contamination. Detailed experimental protocol is provided here.
Experimental setup
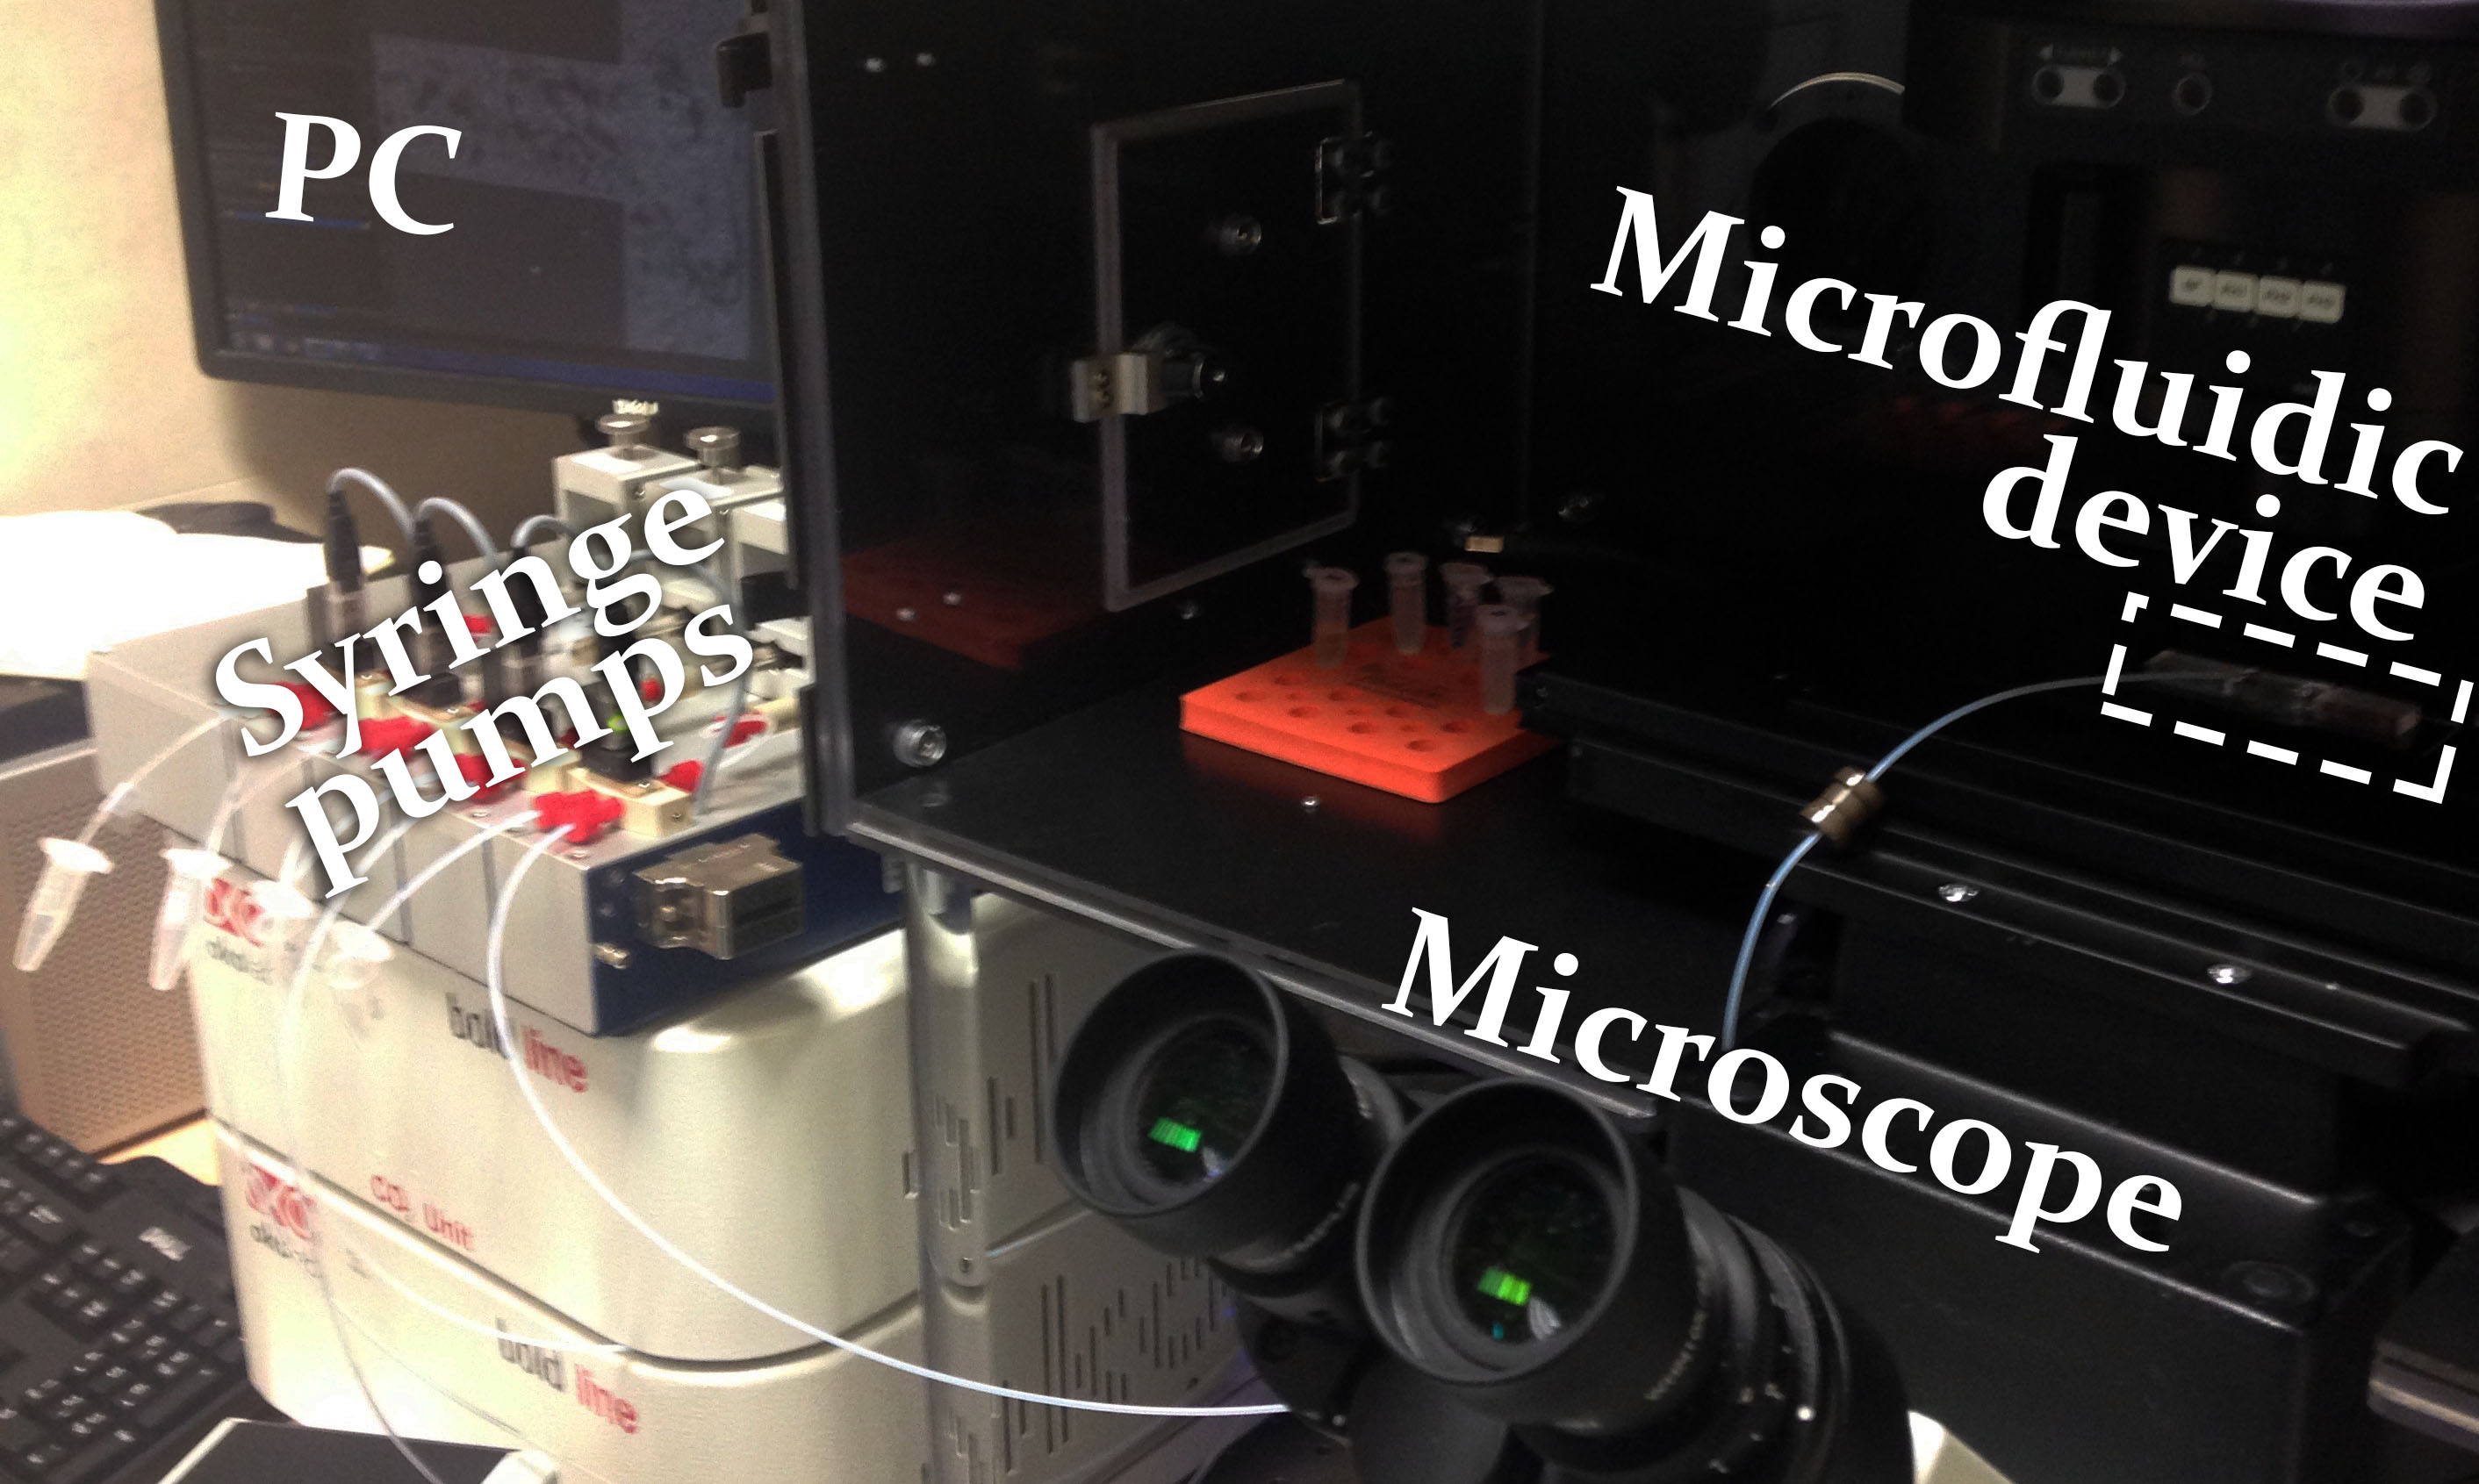
Microfluidic experiments were conducted on a platform already established by the [http://ccy.zcu.cz/ Georgiev lab]. The laboratory is equipped with a precise microfluidic syringe system (neMESYS Low Pressure Syringe Pumps) and a microscopic station enabling fluorescence imaging and live cell microscopy (Olympus IX83, CellSens software).
Microfluidic experiments
On-chip signal transmission characterization
Microfluidic devices were designed and fabricated to characterize the signal transmission in the developed IOD band system. The signal transmission was characterized using spatially separated cell cultures inside a single microfluidic channel in conjunction with live fluorescence microscopy by characterisation of the yeast pheromone pathway activation. Fluorescent reporter proteins were connected to specific functional products to show activation of the yeast pheromone pathway. Details on the synthesis and function of the used reporter plasmids are provided by Module 1. Synthesized reporter plasmids were transformed into specific yeast strains to enable characterization of the signal transmission between yeast cells using set of orthogonal signals designed and synthesized by Module 2.
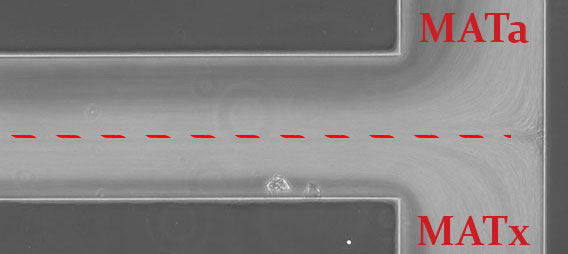
Simple microfluidic devices with T-shaped microchannels were used to characterise the signal transmission between selected yeast strains. Two cell types were selected for each experiment. One cell type transmits the signal in the form of pheromone molecules. Cell with complementary receptors produce the green fluorescent protein (GFP) if the pheromone level reaches certain activation threshold. The individual cell types are introduced to the microfluidic device in parallel through separated inlets. Due to the laminar nature of the flow, the individual cell types remain spatially separated inside the microfluidic device for the whole experiment. The flow is stopped when the microfluidic device is filled with cells. The rest of the experiment is performed statically. Time-lapse fluorescence microscopy is used to dynamically measure levels of GFP expression in the cells that receive the signal.
Signal transmission between Wildtype MATx ↝ MATa: STE2 receptor from Sacharomyces cerevisiae, and between synthetic MATa expressing Saccharomyces cerevisiae alpha-factor; \(\Delta\)Bar ↝ MATa: STE2 receptor from Saccharomyces cerevisiae was characterised. As a negative control, signal transmission between MATa expressing "Candida parapsilosis" alpha-factor; \(\Delta\)Bar ↝ MATa: STE2 receptor from Sacharomyces cerevisiae was studied. No significant level of fluorescence was observed suggesting these signals being orthogonal. The results show that the signal transmission range in saturated culture is approximately 100 μm.
Yeast induced blood agglutination on-chip
Standard agglutination tests are time consuming and require specialized equipment occupying large bench space [Choi2009]. Special microfluidic topologies were designed and fabricated to test yeast-induced agglutination on-chip to lower the time and sample volume requirements. Prior to the experiment, the synthetic yeast cells were perfused and dissolved in plasma, which is the natural medium for the IOD band diagnostic. Blood sample and yeast culture were introduced to the microfluidic chip through separate inlets, and were brought to contact in the chip. During the experiment, the flow was reversed few times to provide sufficient time for the cells to form the eventual cell aggregates, and to decrease the required sample volume. The overall experiment duration did not exceed 60 seconds. The amount of blood necessary for the experiment was approximately 5 μl.
Functioning of location tags was proven by cell clumping consistently observed in mixed samples of yeast cells with the anti-HuA location tag and red blood cells from a type A donor. The control samples, where anti-HuA location tag display was not induced, showed negligible aggregation. The experiments also prove the compatibility of yeast cells with blood samples as no significant clumping or other abnormalities that would indicate overall concept infeasibility were observed in control samples.
Personnel
- Martin Cienciala - Microfluidic experiments
- Vaclav Pelisek - Fabrication of microfluidic devices
- Pavel Fikar - Scientific advisor
References
- ↑ Dan E. Angelescu (2011). Highly Integrated Microfluidic Design. Artech House, Norwood.
- ↑ Ieong Wong (2009). Surface molecular property modifications for poly(dimethylsiloxane) (pdms) based microfluidic devices. Microfluid Nanofluid, 7:291–306.
- ↑ Johana Kuncova-Kallio (2006). Pdms and its suitability for analytical microfluidic devices. In Proceedings of the 28th IEEE EMBS Annual International Conference, New York City, USA, 9, IEEE.
- ↑ Sung Hwan Choi (2009). Microinjection molded disposable microfluidic lab-on-a-chip for efficient detection of agglutination. Microsystem Technologies, 15(2):309-316.
- ↑ P. Fikar (2015). SU8 microchannels for live cell dielectrophoresis improvements. In Proceedings of the Design, Test, Integration and Packaging of MEMS/MOEMS Symposium, Montpellier, FR.
