Team:Heidelberg/Modeling/rtsms

Studying determinants of polymerase efficiency based on an aptamer sensor
Our subproject on small molecule sensing facilitates quantitatively studying in vitro transcription (IVT) by ATP-spinach and malachite green RNA-aptamers. After adding a polymerase to DNA templates, the polymerase binds to the template and starts consuming ATP by incorporating it into transcripts containing the malachite green aptamer. While the concentration of ATP could be monitored by fluorescence of the Spinach2-ATP-Aptamer, the transcript yield was monitored by malachite green fluorescence. This enabled us to follow IVT quantitatively and time-resolved. In particular, we could study the inaccuracy of polymerases reflected by an excess of consumed ATP molecules over the number of ATP molecules in synthesized malachite green aptamers.
To this end, we implemented a mathematical model that describes the formation of "active templates" $T^*$ from unbound DNA-templates $T$ and polymerases $P$, and the consumption of ATP $A$ for the synthesis of malachite green aptamers $M$ (Figure 1A). Because malachite green aptamers contain $n_{A,M}=10$ adenine nucleotides, the rate, at which malachite green is produced, is at least by this factor lower than the rate, at which ATP is consumed. The production of premature abortion products that result from the detachment of the polymerase from the template before completing the transcript leads to an even larger number $n_A>n_{A,M}$. In the model, this number was estimated from experimental data to characterize this polymerase inaccuracy. First, as depicted in Figure 1A, we tried to explain this inaccuracy by a constant number $n_A$ that was independent from DNA-template, ATP or polymerase concentrations (see Table 1 for model equations). Then, we extended the model step-wise until the experimental data could be explained by the model.
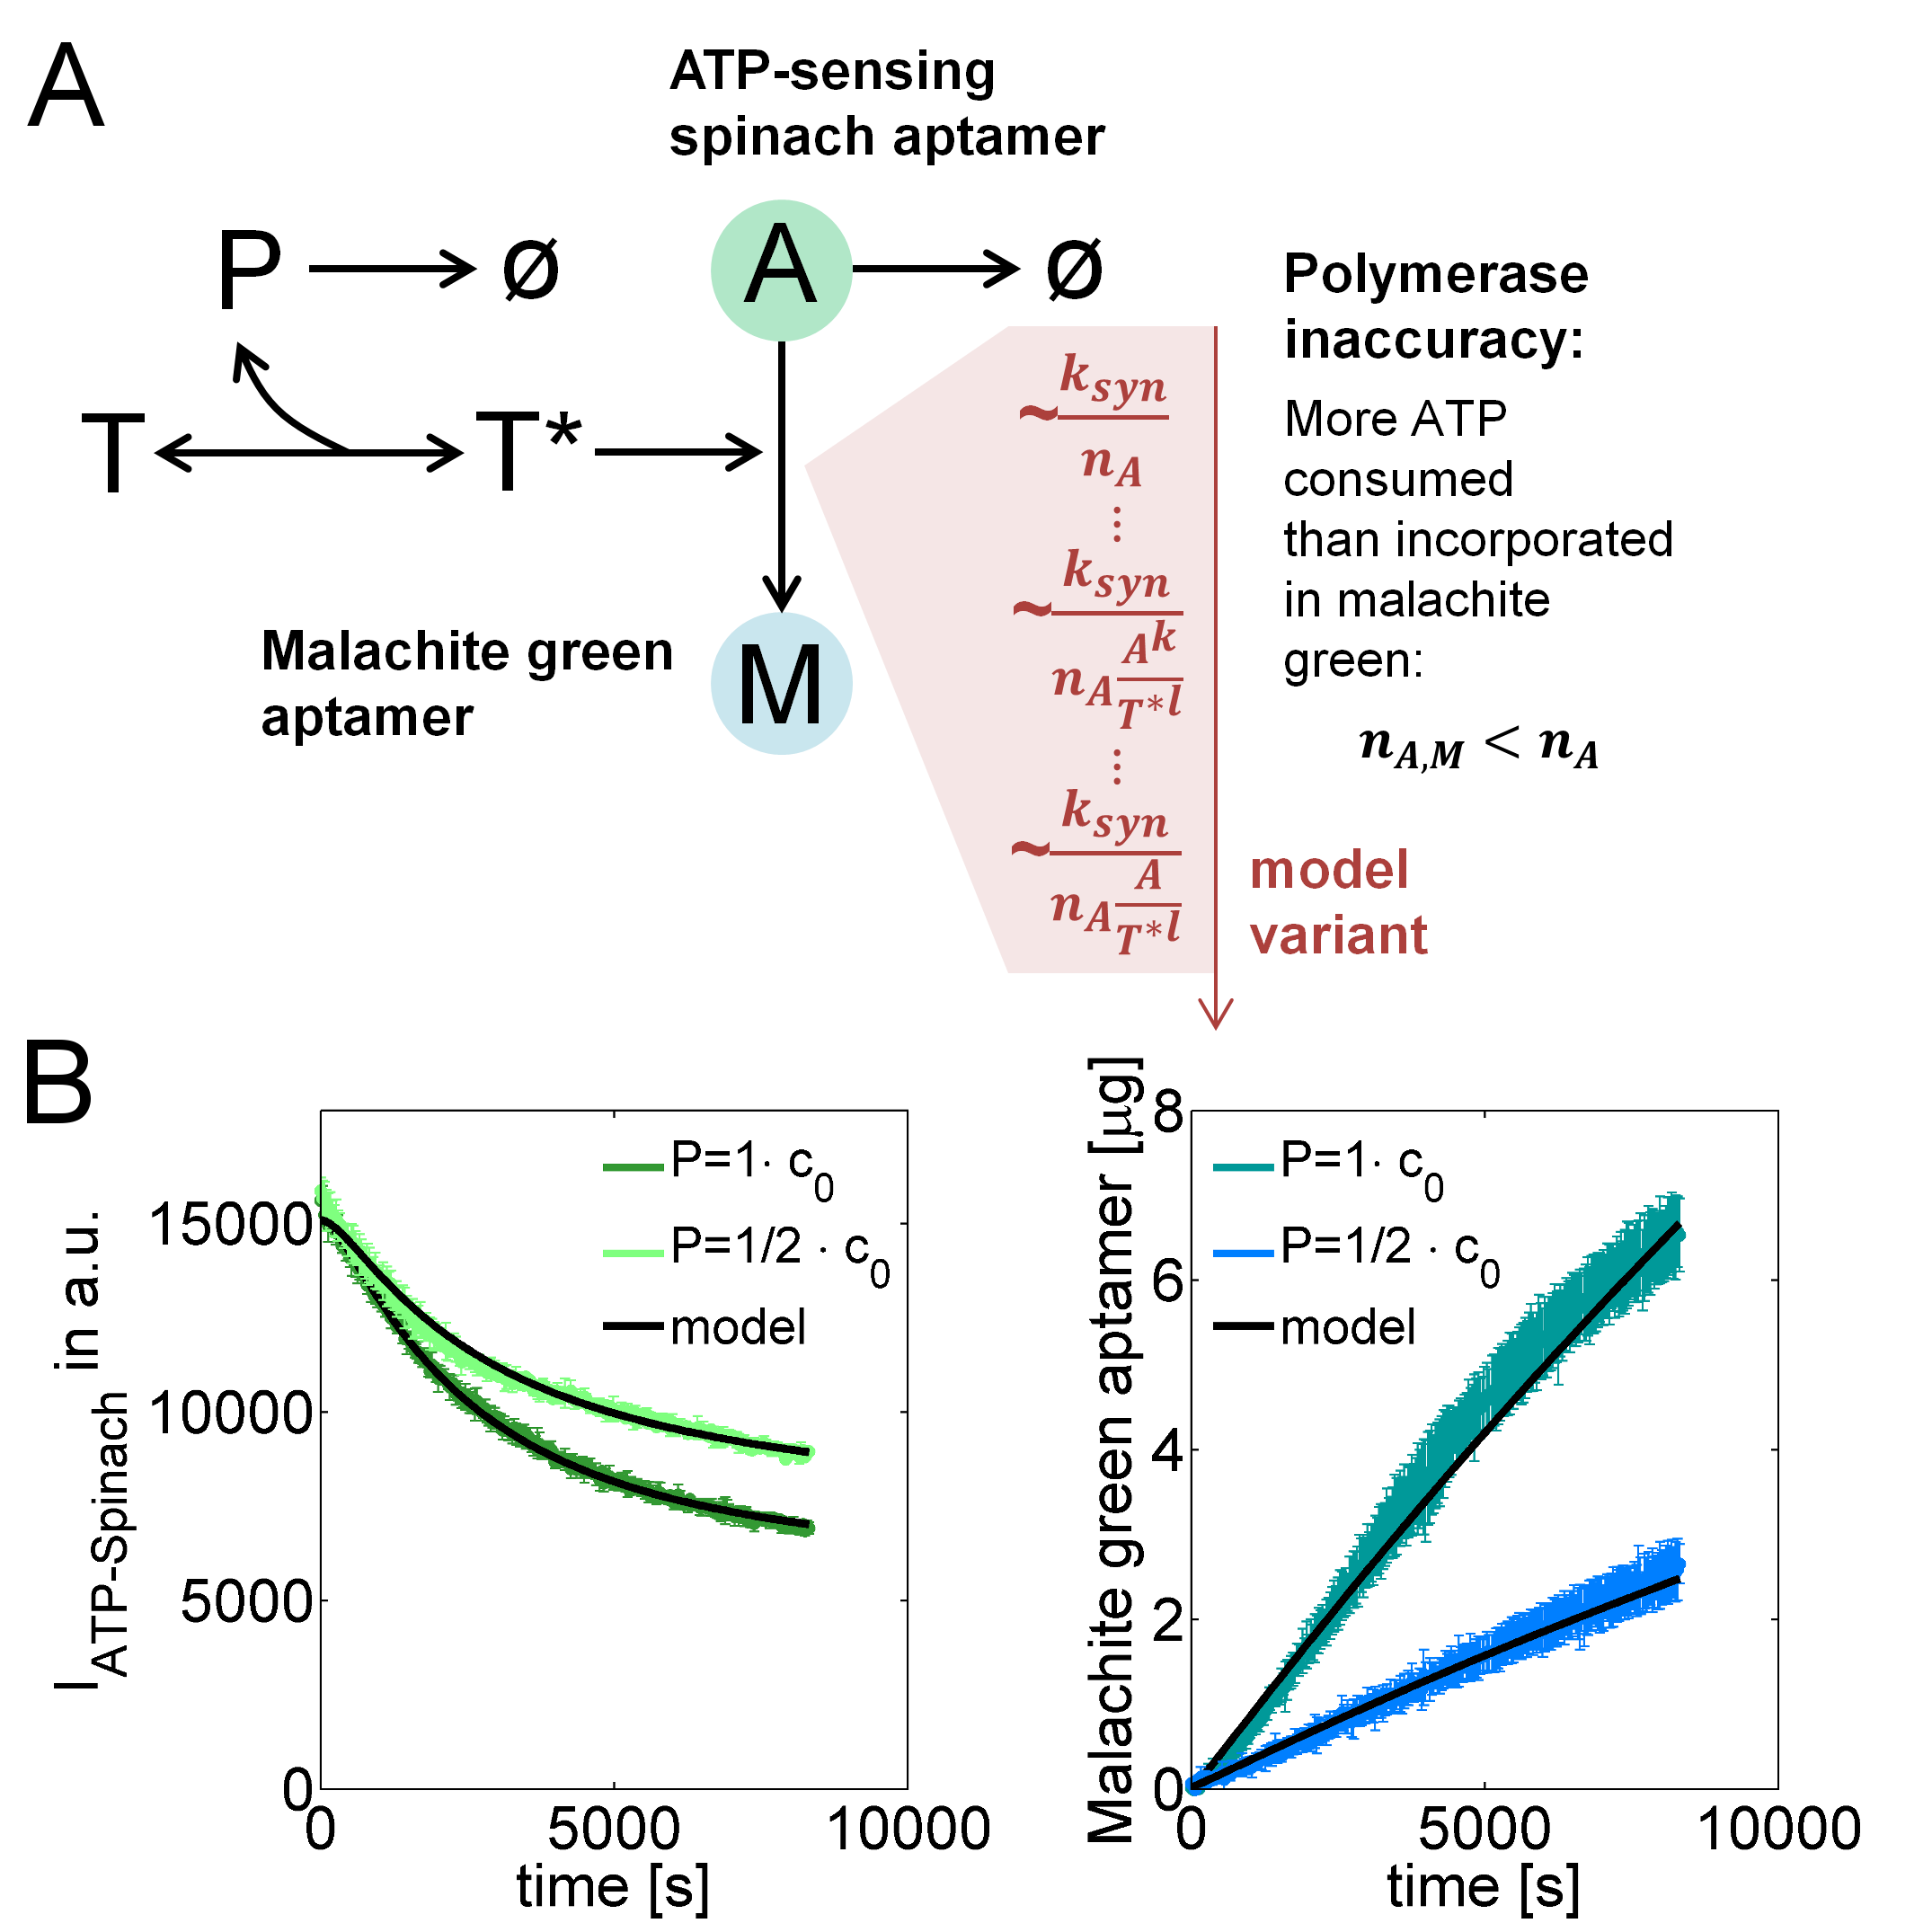
Figure 1. IVT model reactions and fits to experimental data. (A) Model reactions describing reversible assembly of templates $T$ and polymerase $P$ to active templates $T^*$ that incorporate ATP $A$ into malachite green RNA-aptamers $M$ but also into abortion products, leading to a higher number $n_A$ of consumed than ATP molecules $n_{A,M}$ incorporated in malachite green aptamers. (B) Model fits to data at two different polymerase concentrations.
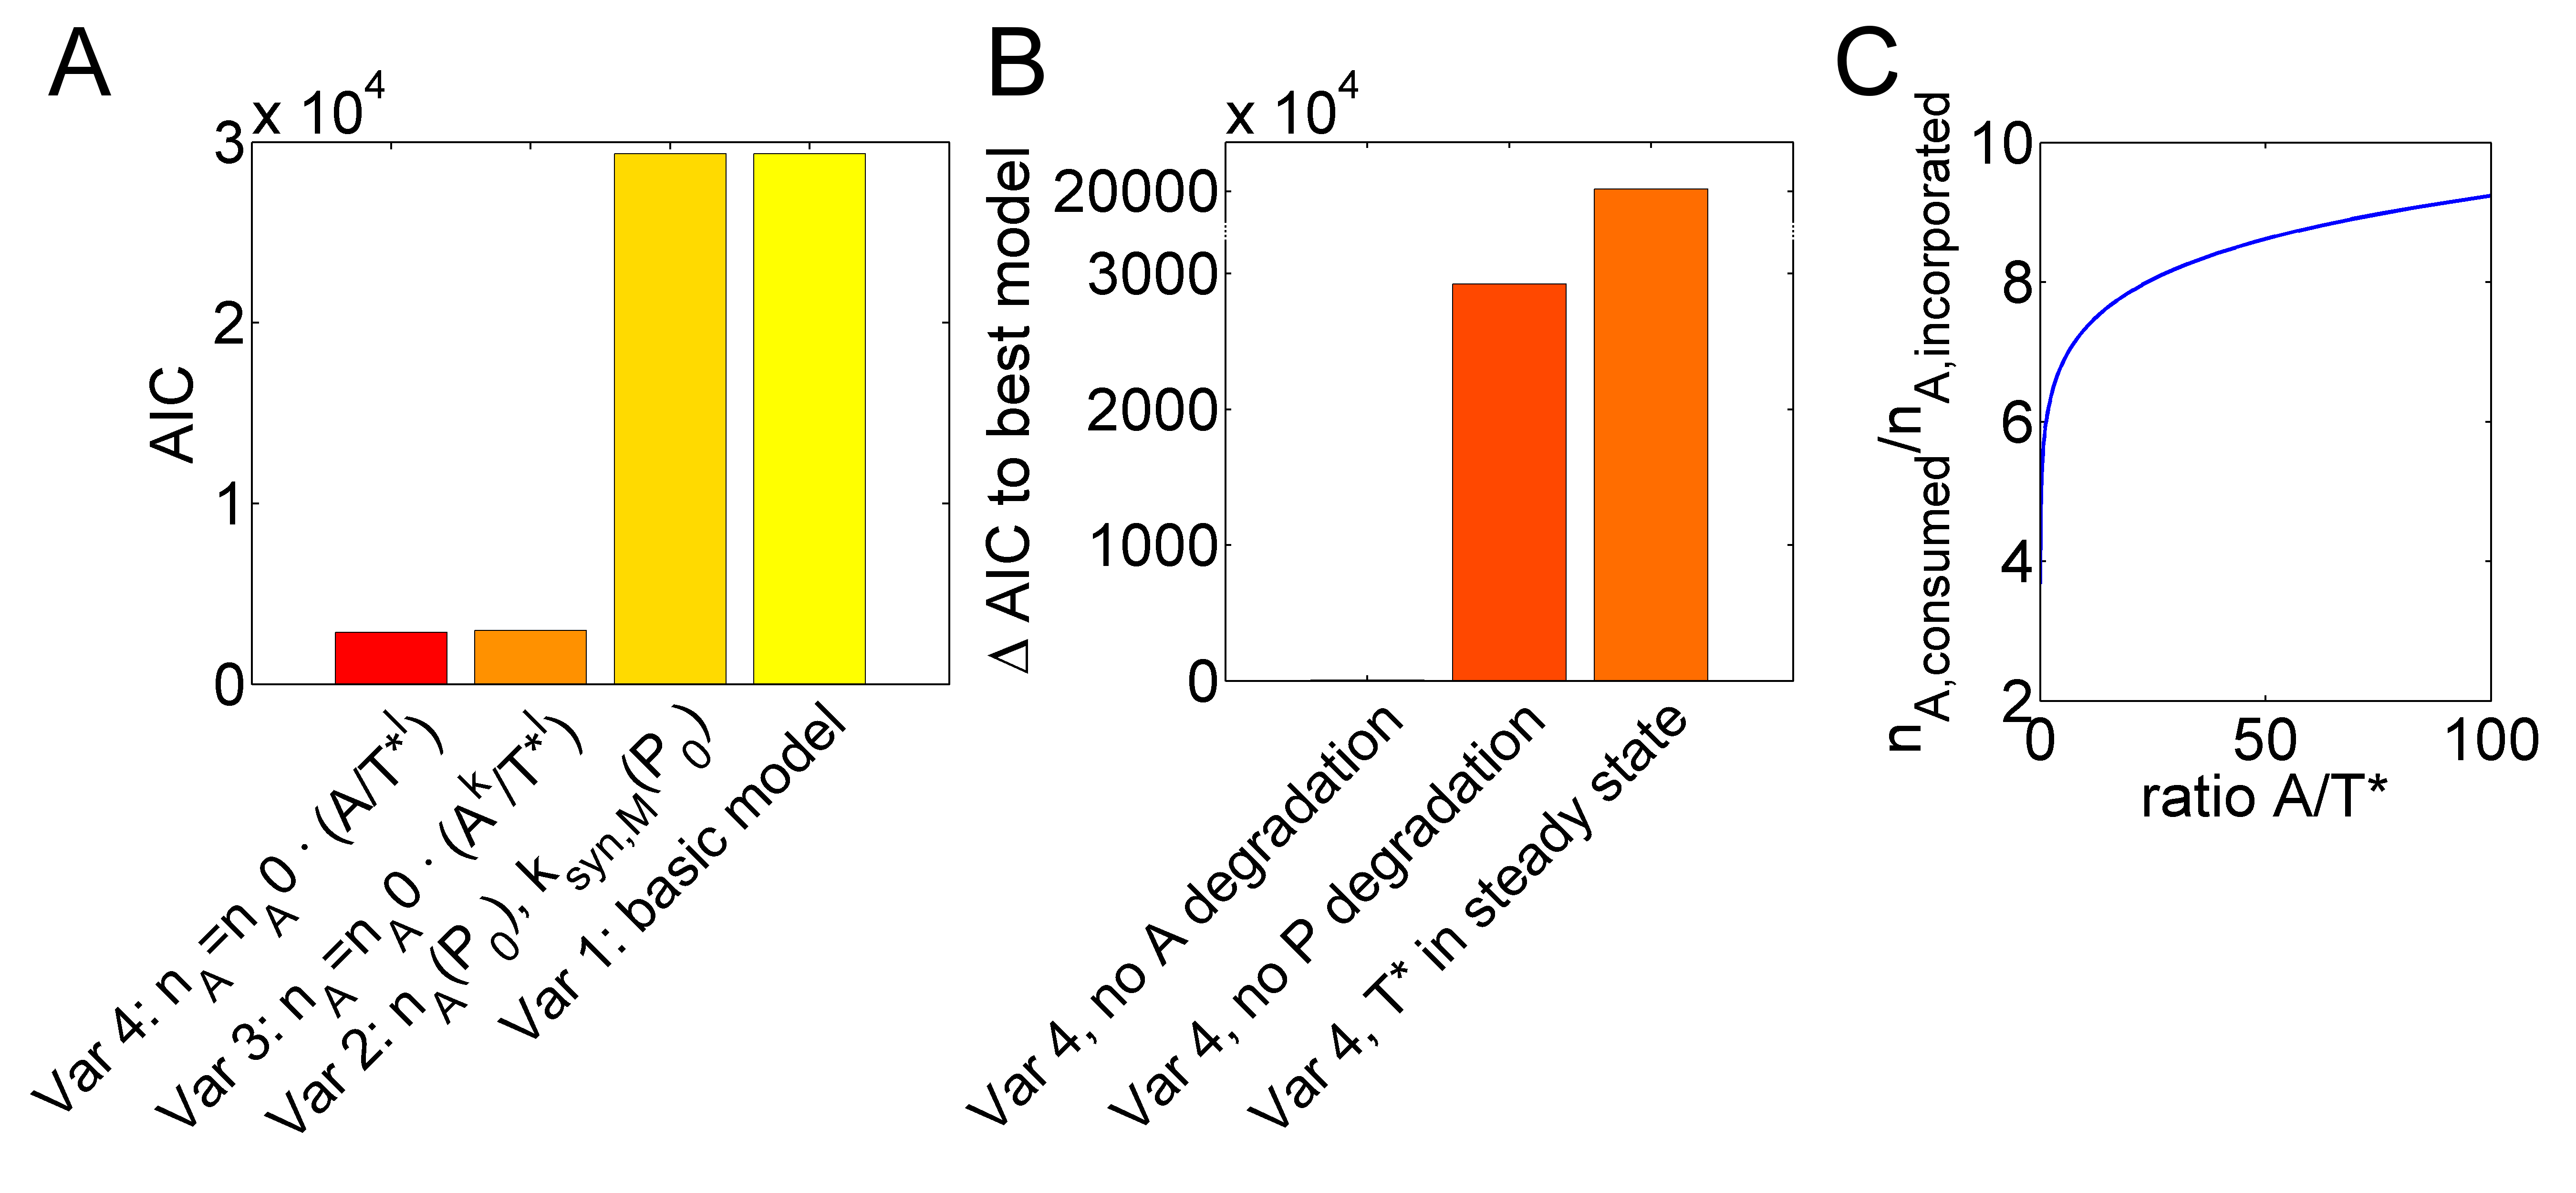
Figure 2. IVT inaccuracy depends on the ATP to active template ratio. (A) A basic model with constant numbers of $n_A$ and synthesis parameters $k_{syn,M}$, was extended to variants with $n_A$ and $k_{syn,M}$ depending on the polymerase concentration (variant 2), $A$- and $T^*$-dependent $n_A$ with exponents $k$ and $l$ (variant 3) or only an exponent for $T^*$ (variant 4). Fitting improvement is indicated by decreasing Akaike information criterion (AIC) values. (B) Reducing the optimal variant 4 by assuming a steady state for $T^*$, no degradation of $P$ or no degradation of $A$ disproved model fits. (C) Model variant 4 can explain increasing inefficiency (higher $n_A$) with decreasing $A/T^*$ ratios.
Table 1. Stepwise changes from the basic model variant 1 to the optimal variant 4 and from variant 4 to variants 4a to 4c
|
Model variant |
Subsequent modifications relative to the previous variant |
Changes in fitting quality |
|
1 |
$k_{syn}$ and $n_A$ independent from polymerase concentrations |
|
|
2 |
Individual $k_{syn}$ and $n_A$ values for different polymerase concentrations |
improvement |
|
3 |
$n_A$ depends on function of $T^*$ and $A$ $n_A=n_{A,0} A^{k} /T^{*l}$ |
improvement, $k\approx0$
|
|
4, best model |
Setting $k=0$ |
improvement |
|
4a |
No degradation of P in variant 4 |
decrease |
|
4b |
No degradation of A in variant 4 |
decrease |
|
4c |
Binding of $P$ to $T$ in steady state in variant 4 |
decrease |
Table 2. Model equations for the basic model and variants 1 to 4c
|
Model species |
Variant |
Equation |
|
$P$ |
Variants 1 to 4, 4c |
$\frac{d[P]}{dt}=-k_{on}[T][P]+k_{off}[T^*]-k_{deg,P}[P]$ |
|
Variant 4a |
$[P](t)=[P](t_{0})\exp\left(-k_{deg,P}t\right)$ |
|
|
Variant 4b |
$\frac{d[P]}{dt}=-k_{on}[T][P]+k_{off}[T^*]$ |
|
|
$T$ |
Variants 1 to 4, 4b, 4c |
$\frac{d[T]}{dt}=-k_{on}[T][P]+k_{off}[T^*]$ |
|
Variant 4a |
$[T]=[T_{tot}]-[T^*]$ |
|
|
$T^*$ |
Variants 1 to 4, 4b, 4c |
$\frac{d[T^*]}{dt}=k_{on}[T][P]-k_{off}[T^*]$ |
|
Variant 4a |
$[T^*]=\frac{[T_{tot}][P]}{K_{d,P}}$ |
|
|
$A$ |
Variants 2 to 4, 4a, 4b |
$\frac{d[A]}{dt}=-k_{syn}[A][T^*]-k_{deg,A}[A]$ |
|
Variant 1 |
$\frac{d[A]}{dt}=-k_{syn}\frac{[A][T^*]}{K_{m,T}+[T^*]}-k_{deg,A}[A]$
|
|
|
Variant 4c |
$\frac{d[A]}{dt}=-k_{syn}[A][^*]$ |
|
|
$M$ |
Variant 2 |
$\frac{d[M]}{dt}=\frac{k_{syn}}{n_{A}}[A][T^*]$ |
|
Variants 1 |
$\frac{d[M]}{dt}=\frac{k_{syn}}{n_{A}}\frac{[A][T^*]}{K_{m,T}+[T^*]}$ |
|
|
Variant 3 |
$\frac{d[M]}{dt}=\frac{k_{syn}}{n_{A,0}\frac{[A]^{k}}{[T^*]^{l}}}[A][T^*]=\frac{k_{syn}}{n_{A,0}}[A]^{1-k}[T^*]^{1+j}$ |
|
|
Variants 4, 4a, 4b, 4c |
$\frac{d[M]}{dt}=\frac{k_{syn}}{n_{A,0}\frac{[A]}{[T*]^{l}}}[A][T^*]=\frac{k_{syn}}{n_{A,0}}[T^*]^{1+j}$ |