Team:Heidelberg/Modeling/aptakinetics

Assisting the optimization of switchable aptamer sensors by mathematical modeling
In our project, several parts are based on the prediction of optimal aptamers for binding target molecules and for designing nucleotide stems in switchable aptamer sensors that can sense their targets by creating peroxidase activity based on molecular dynamics simulations. To test predictions of optimal aptamers and nucleotide stems, we had developed a high-throughput method for quickly screening the function and the dose-response of switchable aptamer sensors. In 96-wells, powers of ten in concentrations of target ligands are tested if they can accelerate the catalysis of luminol, which is detected by a luminescence camera. Here, we use the decay curves of the luminol signal to assess the function of switchable aptamer sensors. In its switched-off state, an aptamer sensor does not accelerate the luminol catalysis. Whereas, in its on-state, binding of the target changes the conformation of the hemin-binding quadruplex. This facilitates the binding of hemin, increases the peroxidase activity and therefore accelerates the catalysis of luminol, which is visible by an accelerated decay of the signal.
Assuming an excess of $H_2O_2$ over luminol, the catalysis depends only on the concentration of luminol reagent $R$ and the concentration of active enzymes. A low binding affinity of hemin $H$ to unligated DNA-aptamer sensors $D$ leads to a certain concentration of hemin-bound active DNA-aptamer sensors $D_H$. In contrast, after binding to the ligand $L$, aptamer sensors $D_{LH}$ are supposed to have a stronger affinity for hemin. Because both forms catalyse the luminol reaction, its time-dependent concentration change can be described by the equation:
$\frac{d[R]}{dt}=-k_{cat}[R](D_{H}+D_{LH}), $
in which $k_{cat}$ is the kinetic parameter for the catalysis. This equation can be solved to
$[R](t)=[R](t_{0})\exp\left(-k_{cat}(D_{H}+D_{LH})t\right)$.
Because we are interested in the enzyme activities, this facilitates an elegant way of parameter estimations. Instead of fitting to time series of experimental data, which might be affected by noise and background signal, we only need to extract the decay constant of the signals. For this purpose, we fitted exponential functions $f(t)=a+exp(-bt)$ to the fluorescence signals from the aptamer sensor screening experiments and calculated enzyme activities.
$b=k_{cat}(D_{H}+D_{LH})$ (Figure 1A), and half-lives of the signal $t_{\frac{1}{2}}= \frac{ln2}{b}=\frac{\ln2}{k_{cat}(D_{H}+D_{LH})}$.
These enzyme activities were used for parameter estimations. In the following, the mathematical model shall be described.
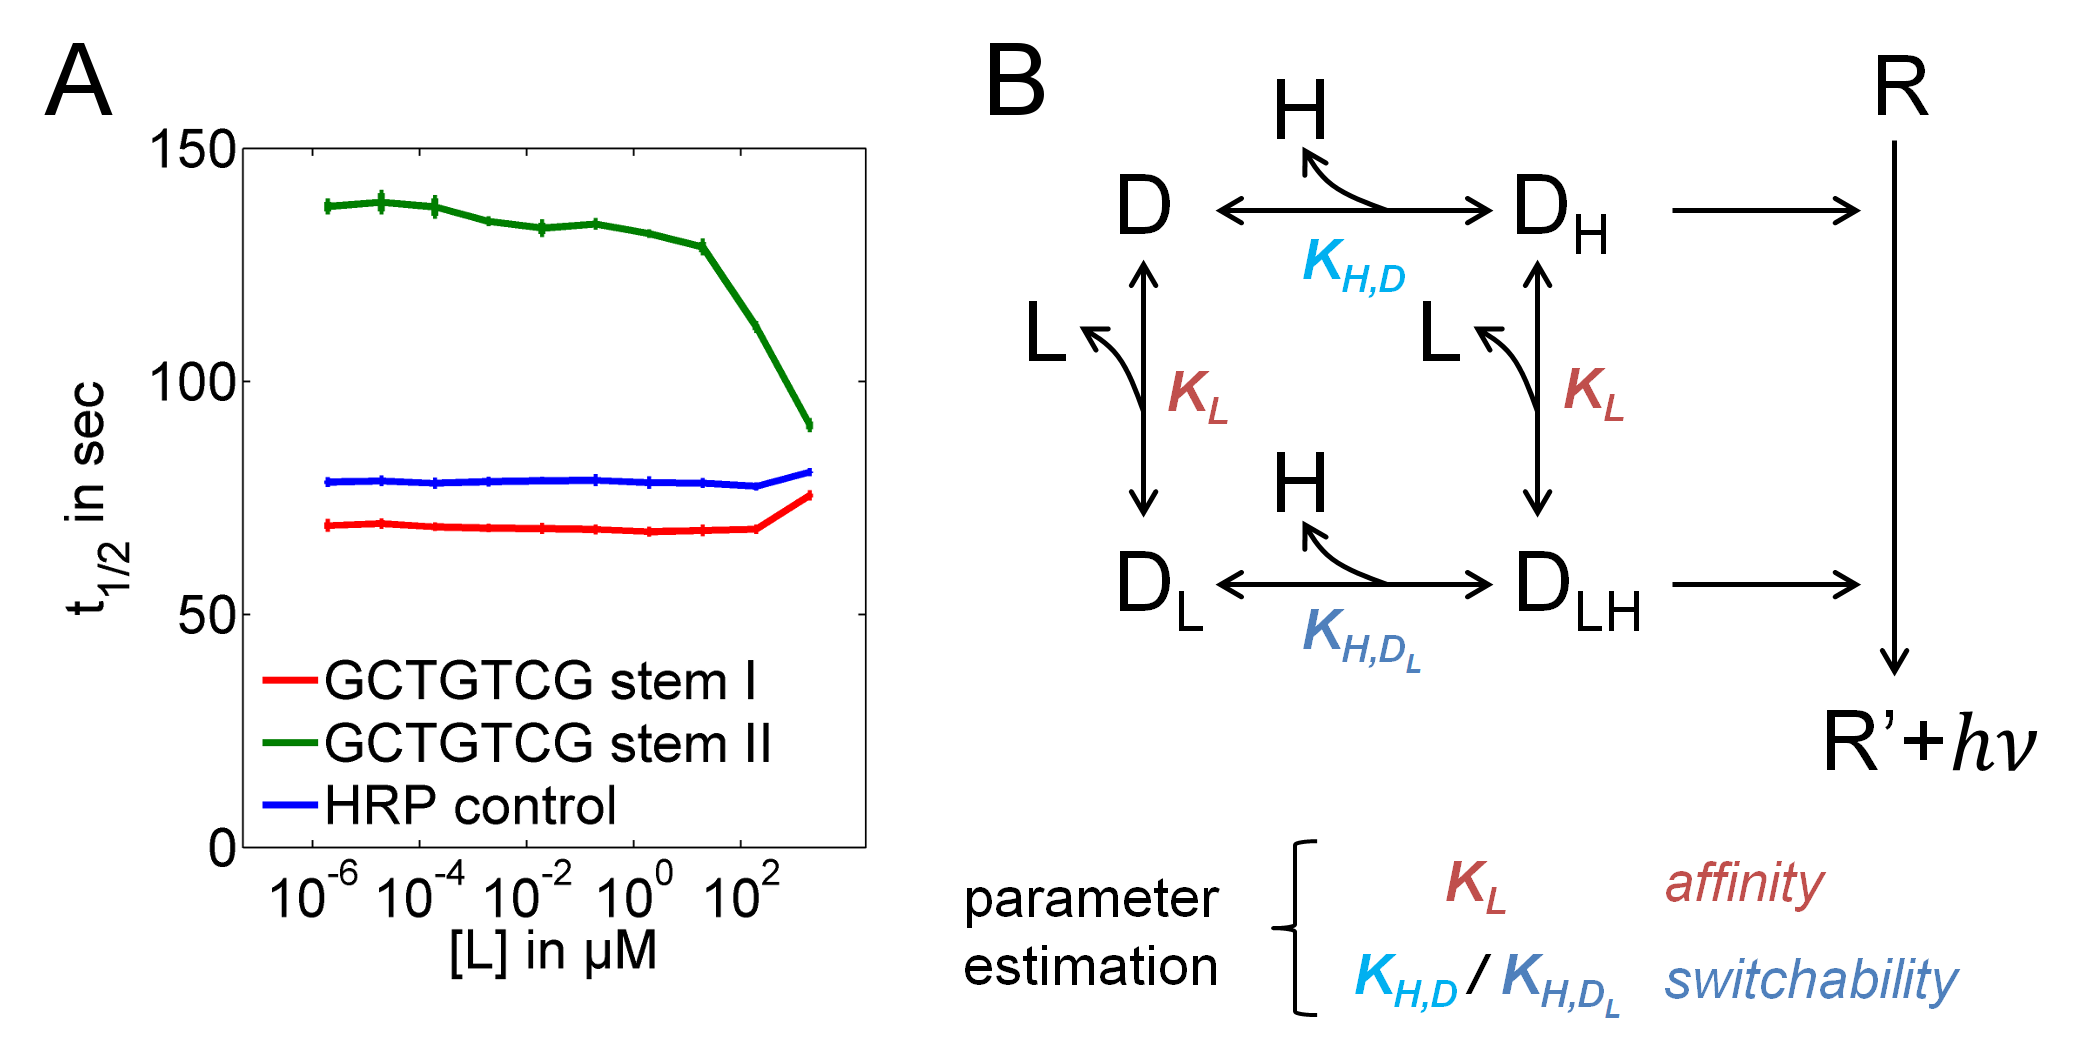
Figure 1. Ligand concentration-dependent reporter signal half-lives. (A) For functional aptamer sensor candidates, the luminescence half-life was decreased with increasing ligand concentration (green trajectory) but not altered if the stem was too weak (red trajectory). (B) Model reactions describing binding of hemin H and target ligands L to the DNA-aptamer sensor D and catalysis of the detection reagent R to estimate parameters for ligand binding and the stem strength ($K_L$, and the ratio $K_{H,D}/K_{H,D_L}$).
Modeling target binding of switchable aptamer sensors
To characterize the functionality of combinations of predicted aptamers and stems in switchable aptamer sensors, our model describes binding of hemin $H$ and ligands $L$ to DNA-aptamer sensors $D$, resulting in $D_L$, $D_H$ and $D_{LH}$. $D_H$ and $D_{LH}$ possess peroxidase activity and catalyze the luminol reaction (Figure 1B). Table 1 shows the model equations. Therein, $k_L$ and $k_{-L}$ describe the binding and unbinding of the ligand $L$, $k_{H,D}$ and $k_{-H,D}$ binding and unbinding of hemin to the unligated aptamer sensor $D$, and $k_{H,D_L}$ and $k_{-H,D_L}$ of hemin to the ligand bound aptamer sensor. Because a stronger enzymatic activity could be observed in the presence of the ligand, $k_{H,D_L}$ can be assumed to be larger than $k_{H,D}$.
Table 1. Model equations describing target binding of switchable aptamer sensors|
$\frac{d[D]}{dt}=-k_{L}[L][D]+k_{-L}[D_{L}]-k_{H,D}[H][D]+k_{-H,D}[D_{H}]$ |
(1) |
|
$\frac{d[D_{L}]}{dt}=k_{L}[L][D]-k_{-L}[D_{L}]-k_{H,D_{L}}[H][D_{L}]+k_{-H,D_{L}}[D_{LH}]$ |
(2) |
|
$\frac{d[D_{H}]}{dt}=-k_{L}[L][D_{H}]+k_{-L}[D_{LH}]+k_{H,D}[H][D]-k_{-H,D}[D_{H}]$ |
(3) |
|
$\frac{d[D_{LH}]}{dt}=k_{L}[L][D_{H}]-k_{-L}[D_{LH}]+k_{H,D_{L}}[H][D_{L}]-k_{-H,D_{L}}[D_{LH}]$ |
(4) |
|
$\frac{d[L]}{dt}=-k_{L}[L][D]+k_{-L}[D_{L}]-k_{L}[L][D_{H}]+k_{-L}[D_{LH}]$ |
(5) |
|
$\frac{d[H]}{dt}=-k_{H}[H][D]+k_{-H}[D_{H}]-k_{H,D_{L}}[H][D_{L}]+k_{-H,D_{L}}[D_{LH}]$ |
(6) |
Because none of the interacting species is in excess, we had to include equations also for $L$ and $H$ and cannot assume constant concentrations for any reaction partner. In experiments, we left a time interval of several minutes between the mixture of $H$, $D$ and $L$, and the addition of the luminol reagent $R$ to obtain a steady state before starting the luminol reaction.
For parameter estimations, we used the MATLAB toolbox PottersWheel
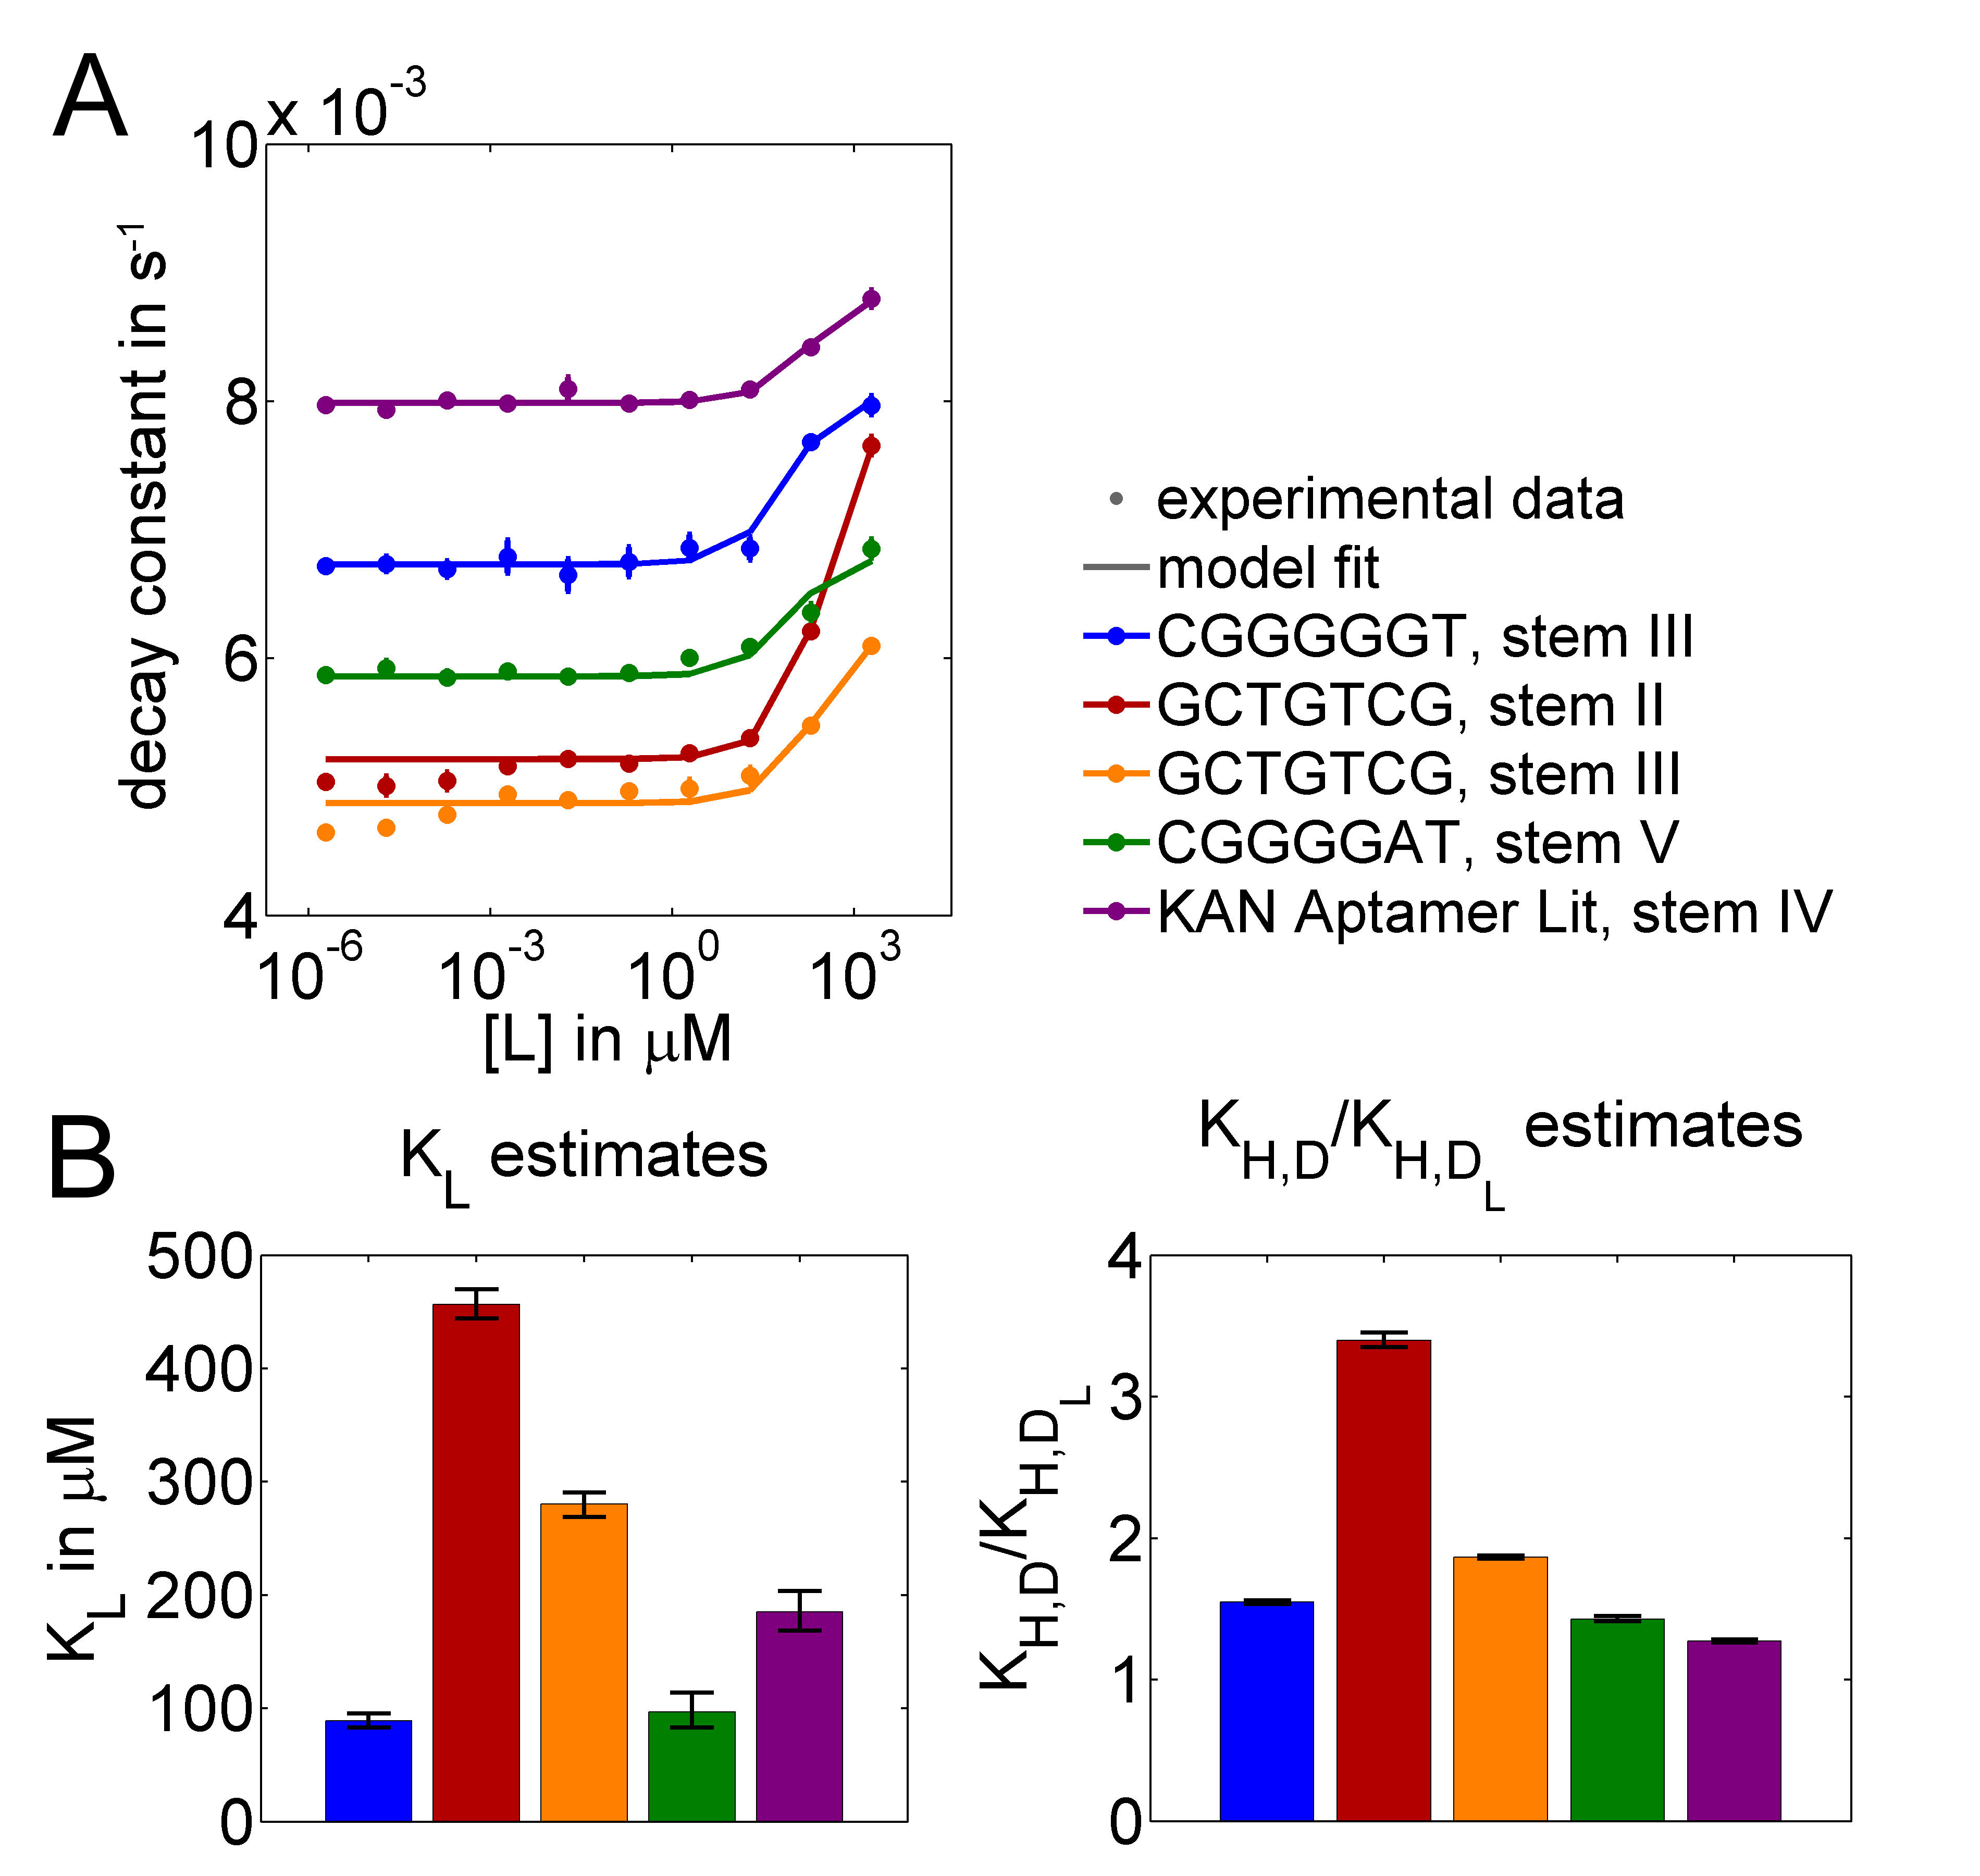
Figure 2. (A) Extracted enzyme activities together with model fits for predicted aptamer-stem combinations and a literature aptamer for kanamycin. (B) Estimated values of $K_L$ and of the ratios $K_{H,D}/K_{H,D_L}$ that reflect the switching dynamics of the stems (error bars: 95% confidence intervals from profile likelihood estimates).
We estimated parameters for three experimentally tested kanamycin aptamers included in aptamer sensors, one of them with two different stems, and a literature Aptamer variant.
Figure 2A shows that the model can well explain the experimental data. When fitting $k_{H,D}$ and $k_{H,D_L}$ at the same time, we observed that only $k_L$ values were identifiable. Therefore, we decided to only estimate the ratios $K_{H,D}/K_{H,D_L}$. We were particularly interested in these ratios because they reflect the affinity change for hemin binding that is caused by ligand binding. When fitting the ratios together with $k_L$, all parameters were identifiable, which was assessed by profile likelihood estimation
In conclusion, modeling facilitated a quantitative characterization of the software-predicted candidate molecules and represents an essential component in the development chain for optimal aptamer sensors.
Table 2. Parameter estimates for switchable aptamer sensor candidates
|
candidate |
parameter |
best fit |
lower CI |
upper CI |
% |
|
CGGGGGT, stem III
|
$k_L $ in $1/(s\cdot \mu M)$ |
0,0113 |
0,0105 |
0,0120 |
13,3 |
|
$K_{H,D}/K_{H,D_L}$ |
1,54 |
1,53 |
1,56 |
2,0 |
|
|
GCTGTCG, stem II
|
$k_L $ in $1/(s\cdot \mu M)$ |
0,0022 |
0,0021 |
0,0023 |
9,5 |
|
$K_{H,D}/K_{H,D_L}$ |
3,40 |
3,35 |
3,45 |
2,9 |
|
|
GCTGTCG, stem III
|
$k_L $ in $1/(s\cdot \mu M)$ |
0,0035 |
0,0034 |
0,0037 |
8,6 |
|
$K_{H,D}/K_{H,D_L}$ |
1,87 |
1,86 |
1,88 |
1,1 |
|
|
CGGGGAT, stem V
|
$k_L $ in $1/(s\cdot \mu M)$ |
0,0070 |
0,0070 |
0,0121 |
72,9 |
|
$K_{H,D}/K_{H,D_L}$ |
1,47 |
1,41 |
1,47 |
4,1 |
|
|
KAN Aptamer Lit, stem IV |
$k_L $ in $1/(s\cdot \mu M)$ |
0,0049 |
0,0049 |
0,0059 |
20,7 |
|
$K_{H,D}/K_{H,D_L}$ |
1,28 |
1,26 |
1,28 |
1,6 |