Team:Cambridge-JIC/MicroMaps
Image Stitching
This is the technology that makes MicroMaps all possible...and the reason it is in early alpha. Though the translation mechanism of our microscope allows panning control as fine as a single micron (see our Tech Specs page), the material used for 3D-printing and the quality of the motors used impairs the accuracy with which translation can be achieved. A subtle point of the flexure mechanism, used for stage movement, is that shifting in one direction also causes a small angle twist of the frame of view. This in turn makes it difficult to know which parts of the slide go where in our interface. Luckily, image stitching algorithms have been created to find where two or more images match and combine them together (such as in the panorama feature on modern smartphones). Using these algorithms we can determine precisely how the microscope imagery should be shown on screen and eliminate the seams between them. We can also use the position information derived to correct for translational inaccuracies so we can know with confidence where you are on your slide and enable you to drop pins on features you like. In addition, the overlaying of the stitched images actually removes the black artifacts deposited by dirt on the CCD or imperfections of the optics.
There are many stitching algorithms that have been developed, though unfortunately some of the best are proprietary. As an open-source alternative, our algorithm is significantly less robust and this has been a major roadblock in the development of MicroMaps. Eventually, we were forced to disable the free panning mechanism on MicroMaps alpha. It has also meant that some of the other features that we had in mind have not been integrated yet.
Algorithms required for MicroMaps:
feature detecting algorithms: (these find interesting things in images)
proprietary: SIFT, SURF, FAST
free: ORB - actually this algorithm is also pretty good, according to its developers [1]
feature MATCHING algorithms: (these try to match the same interesting things in two images)
proprietary: FLANN - fast and reliable
free: BF - Brute-Force, unreliable
Our research in the area indicates that the SIFT + FLANN combination is very good. Further understanding of the subject might be gained from Google's PhotoSphere project.
Examples:
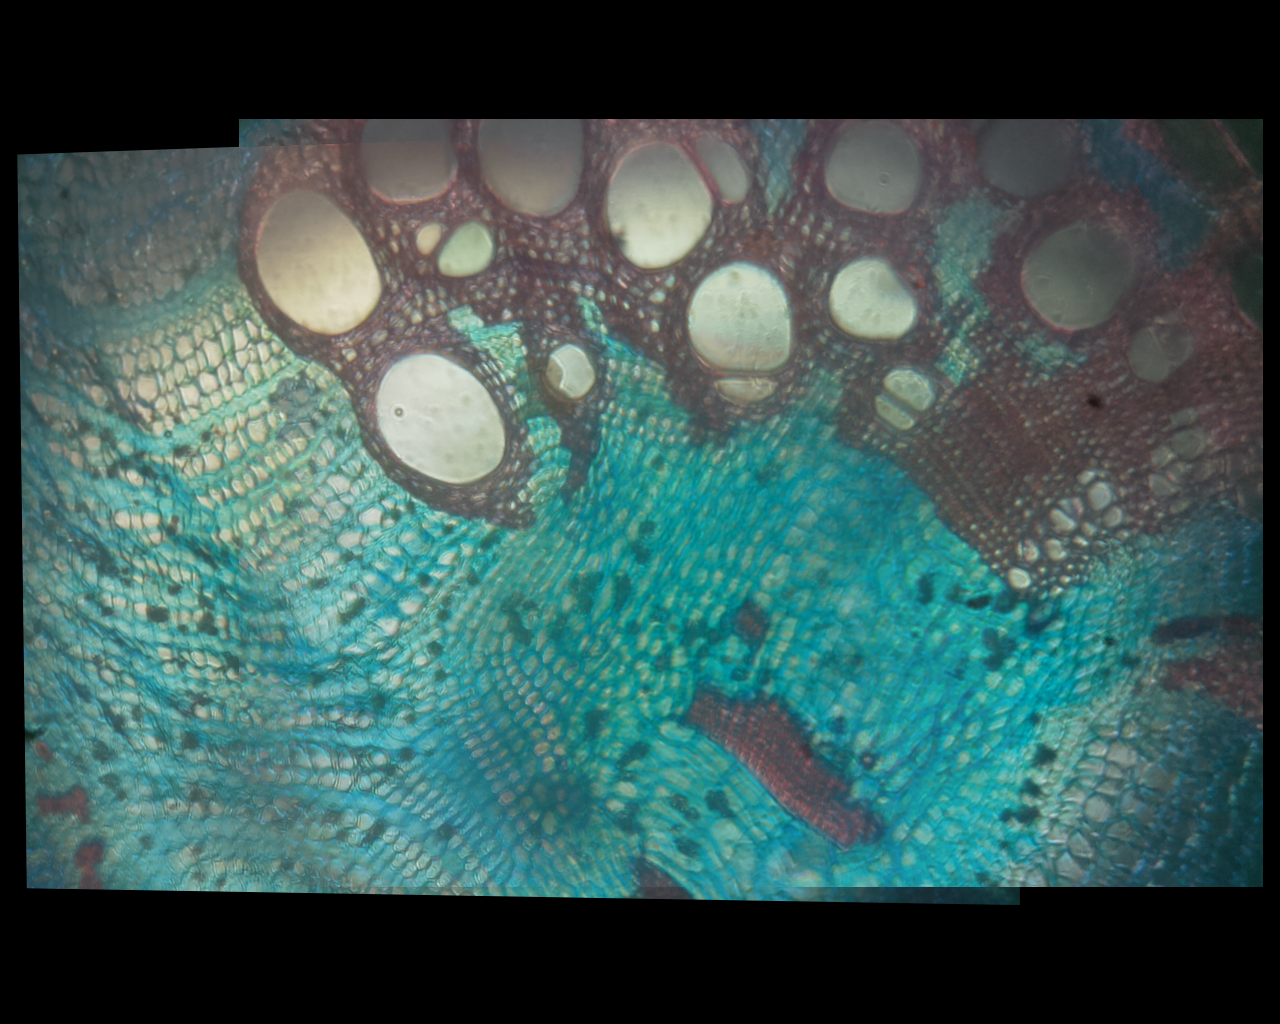
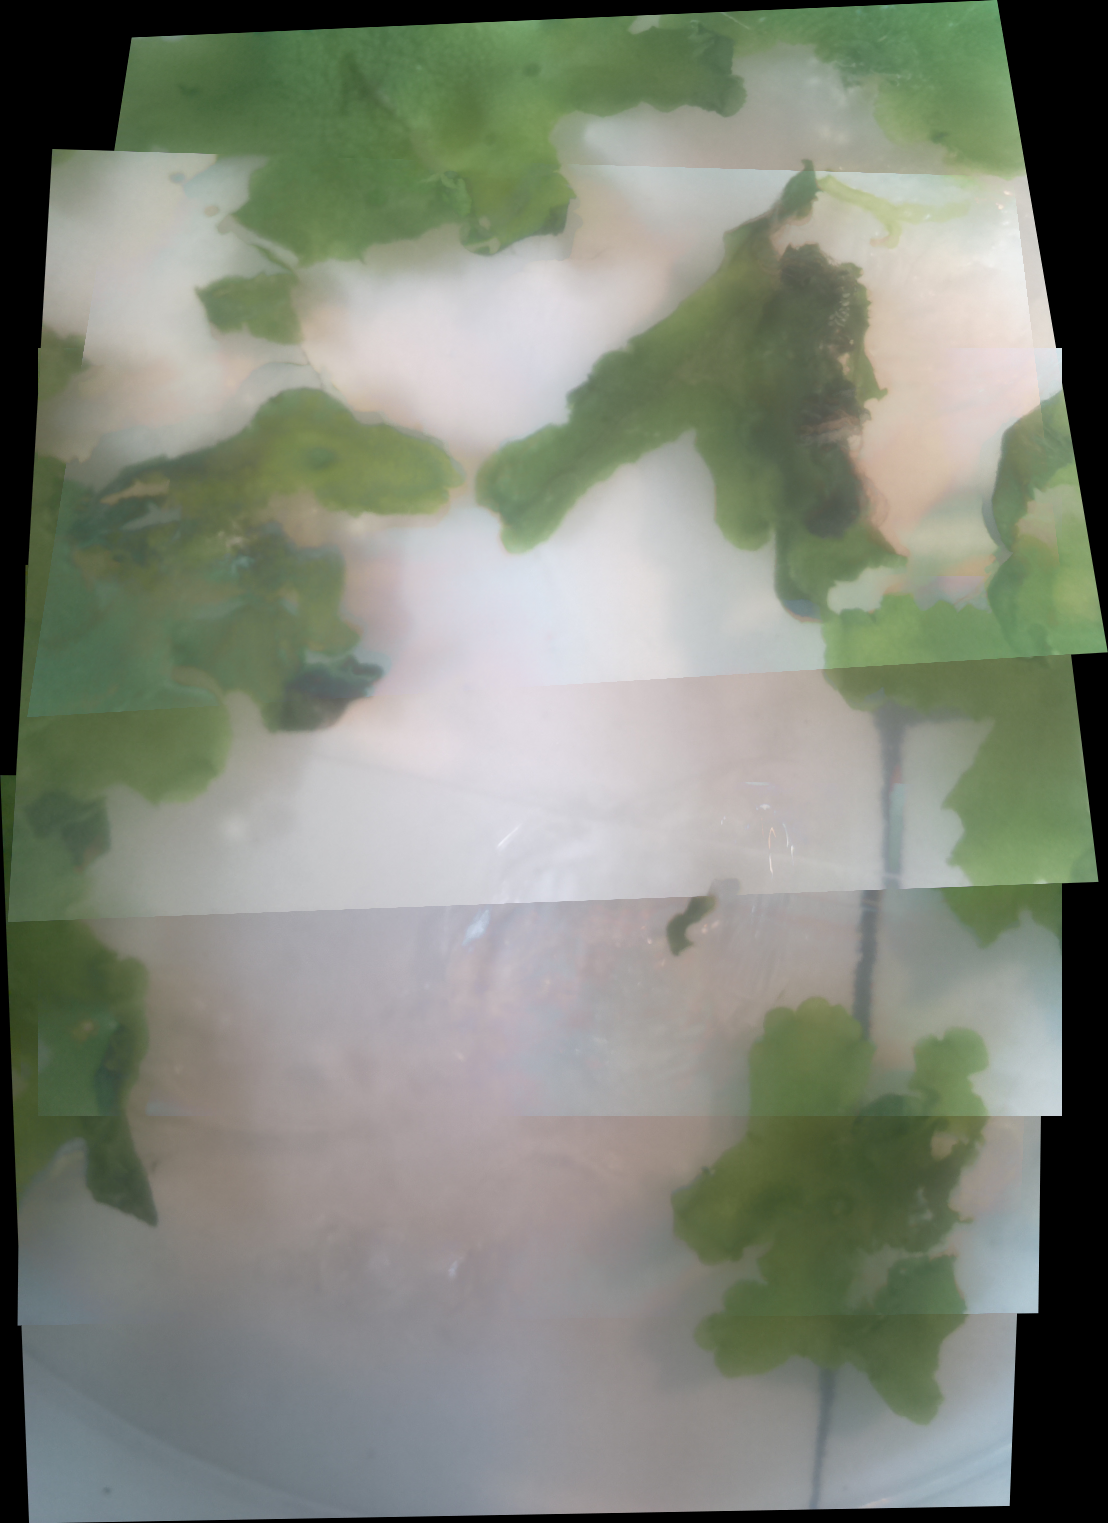
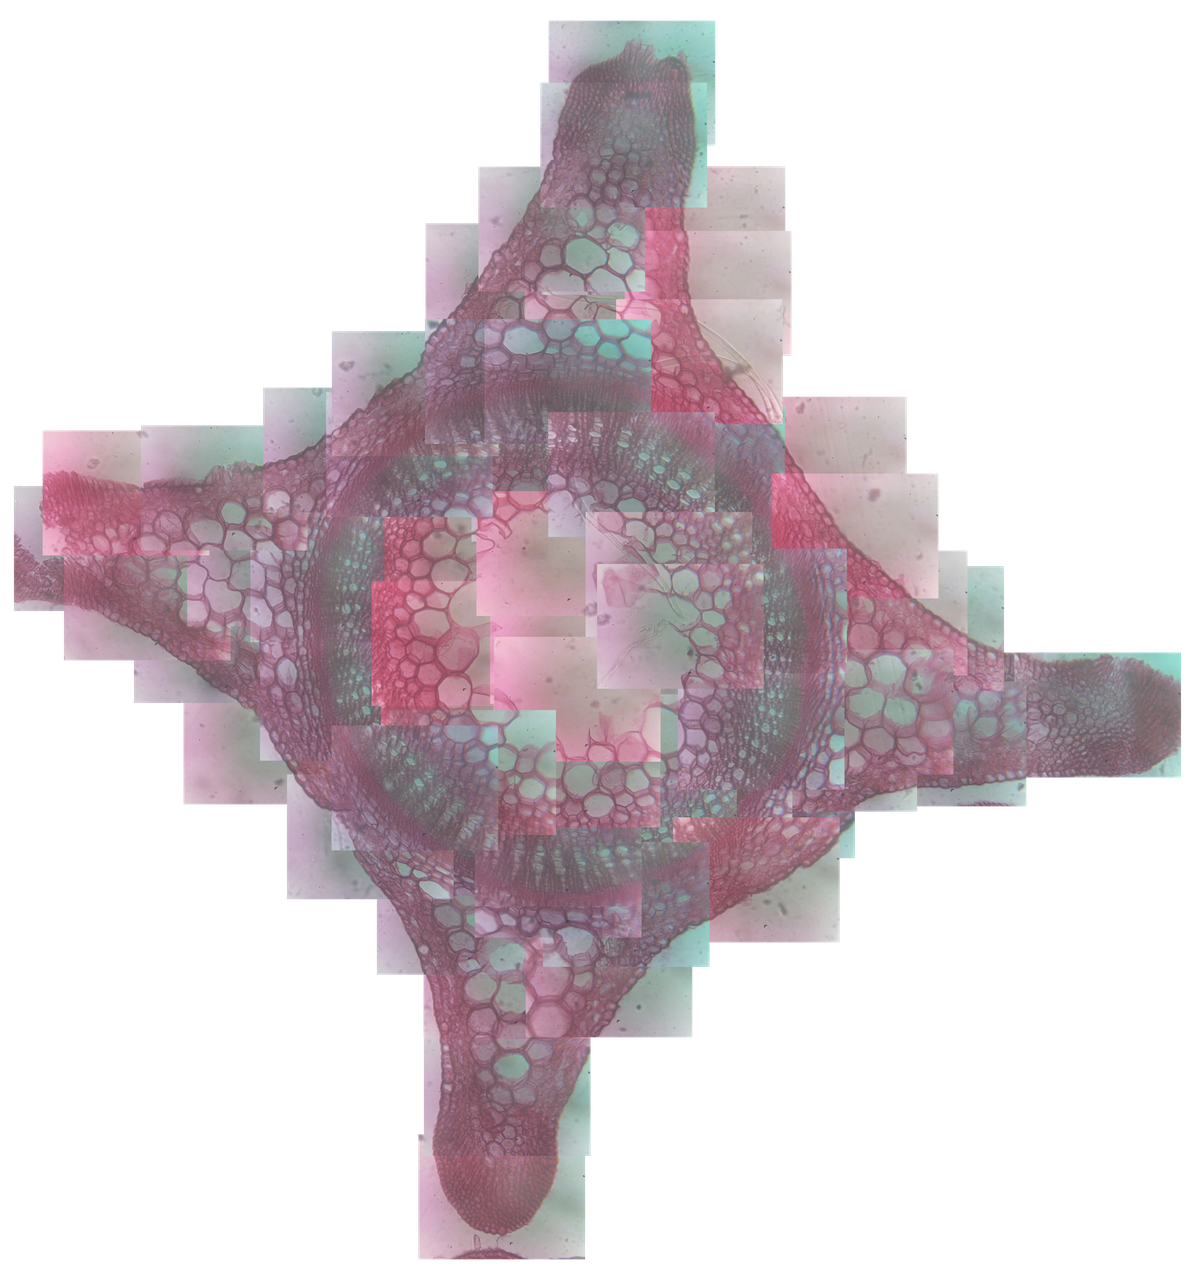
Figure 1: First successful stitching of two images (Nigerian liane). Figure 2: Stitching implemented on macroscopic images of Marchantia polymorpha as part of our Stretch Goals. Note the accuracy of the stitching. Figure 3: Pretend stitching (performed manually) - shows how MicroMaps is ultimately intended to work.
How it works: More concretely, MicroMaps keeps a collection of images it has taken along with the corresponding expected physical coordinates. MicroMaps will request small regions (tiles) of the slide one-by-one to fill up its field of view. When a tile is requested the software will look through its collection to see if it has already captured that region, and will join any seams it finds if multiple images match that tile. If no images match that tile, it will take a series of overlapping images between a nearby (in terms of expected coordinates) image and the desired tile. For each image, it will use the stitching algorithm to determine accurate coordinates representing the image and compare them to the expected coordinates. This is essential to correct for hardware noise and inaccuracies, and will allow a seamless image to be constructed from these small tiles. The accuracy obtained, combined with calibration data, will then allow for precise measurements to be made. The accurate positioning information will also allow pins to be dropped so interesting features can be returned to later.
Problems: This works well for fixed samples, but what about live samples? With the current difficulties, we are not prepared to apply MicroMaps logic to motile samples. Moving samples are infeasible with current processing delays. For now, we recommend using the WebShell. We are still working on this issue, expect the ability to follow moving specimens in WebShell v2, and perhaps in MicroMaps v2 with some speed improvements.
Image stitching, and the whole MicroMaps construct, were developed by Will, with useful feedback and advice from the rest of the Software team.
References:
[1] Ethan Rublee, Vincent Rabaud, Kurt Konolige, Gary Bradski. ORB: an efficient alternative to SIFT or SURF, Computer Vision (ICCV), 2011 IEEE International Conference on. IEEE, 2011.
Image Processing
The purpose of microscopy is to extract some useful information about the specimen: screen for a particular phenotype, examine fluorescence, measure sizes, count cells, recognize distinctive features, eg. nuclei. Focusing on a specimen is just a small part of the art of microscopy. The actual scientific challenge is to interpret the image. Imagine a program that does this for you. This is what we had in mind when creating MicroMaps. To achieve this, we had to implement different types of image processing algorithms. Image recognition is still work in progress, but we believe that we have laid out the framework for a new, smarter, approach to digital microscopy.
The Method: We tested our image processing software on some images of Marchantia gemma on a Petri dish with agar, This was intended to be a step towards our Stretch Goal - an automated screening desktop system. To write the software, the OpenCV library was used. Two types of image processing algorithms were implemented:
Standard thresholding
This makes an image grey-scale and searches for the dark areas. We started off with a basic contrast increase to isolate the darker areas of the image, which we assume would correspond to samples. We then followed the steps in a paper [2] which was supposed to yield much better sample isolation for samples which look faint, and are hard to distinguish from their background. This ended up detecting dents in the agar gel along with the samples. To resolve this issue we came up with the next idea...Colour detection
An eye dropper was added to select the upper and lower colour darknesses to search for (the user would click to select these colours). These colours correspond to areas of the sample with better and worse illumination respectively.Also, a slider that allows you to change the 'darkness' of the sample colour was added. This generally varies depending on room lighting conditions. With this implementation, the program performed much better, detecting the Marchantia gemma before the agar dents.


Figure 4: Sample recognition working on Petri dish with Marchantia gemma. The program highlights the samples it finds in red. Note that the agar dent is not included in the final output. This was achieved using the color detection algorithm.
Microscopic image processing: The colour detection used above can theoretically be easily adapted to work with fluorescent samples – this would prove useful for sample counting and detection of, for example, samples that successfully express a specific fluorescent protein. A similar strategy can be applied to stained samples with interesting coloured features: for example to recognize stained nuclei (eg. with toluidine blue) and in this way distinguish eukaryotic cells.
However, we have not implemented sample recognition into MicroMaps Alpha, mostly due to lack of time and difficulties for coping with multicolour images. Still, the script for image recognition is in the software package for you to try out (and improve, also in the source code download on the Downloads page under img_processing/identificationTesting/marchantiaIdentification_gui.py).
Image recognition was developed by Ocean, with useful feedback and advice from the rest of the Software team.
References:
[2] Chen, L., Chien, C. and Nguyen, X. (2013). An effective image segmentation method for noisy low-contrast unbalanced background in Mura defects using balanced discrete-cosine-transfer (BDCT). Precision Engineering, 37(2), pp.336-344.