Difference between revisions of "Team:TJU/Results"
Ggjyliuyue (Talk | contribs) |
|||
| (21 intermediate revisions by 4 users not shown) | |||
| Line 10: | Line 10: | ||
#body-PART{width:1100px;margin-left:auto;margin-right:auto;height:auto;background-color: #FFF;} | #body-PART{width:1100px;margin-left:auto;margin-right:auto;height:auto;background-color: #FFF;} | ||
#body-PART-head{width:1100px;background-color:#FFF;font-family: "Lucida Grande", "Lucida Sans Unicode", "Lucida Sans", "DejaVu Sans", Verdana, sans-serif;color:rgba(204,204,255,1);font-size: 50px;float: left;text-align:center} | #body-PART-head{width:1100px;background-color:#FFF;font-family: "Lucida Grande", "Lucida Sans Unicode", "Lucida Sans", "DejaVu Sans", Verdana, sans-serif;color:rgba(204,204,255,1);font-size: 50px;float: left;text-align:center} | ||
| − | #body-PART-l{width:22.2%;height: | + | #body-PART-l{width:22.2%;height:9100px;background-color:#FFF;float:left;} |
#body-PART-r{width:76.8%;height:auto;background-color:#FFF;float:left;margin-top:10px;margin-left:1%;text-align: justify;font-size:16px;font-family:Arial;line-height:150%;} | #body-PART-r{width:76.8%;height:auto;background-color:#FFF;float:left;margin-top:10px;margin-left:1%;text-align: justify;font-size:16px;font-family:Arial;line-height:150%;} | ||
h2{font-family:Arial;color:#006;font-size:40px;align:center} | h2{font-family:Arial;color:#006;font-size:40px;align:center} | ||
| Line 52: | Line 52: | ||
if(s > t - 70){ | if(s > t - 70){ | ||
$('.fixed').css('position','fixed'); | $('.fixed').css('position','fixed'); | ||
| − | if(s + fh - | + | if(s + fh - 11000 > mh){ |
$('.fixed').css('top',mh-s-fh+'px'); | $('.fixed').css('top',mh-s-fh+'px'); | ||
} | } | ||
| Line 125: | Line 125: | ||
</li> | </li> | ||
<li class="hmain"><a href="https://2015.igem.org/Team:TJU/Results">Results</a> | <li class="hmain"><a href="https://2015.igem.org/Team:TJU/Results">Results</a> | ||
| + | <ul> | ||
| + | <li> | ||
| + | <a href="https://2015.igem.org/Team:TJU/Results#Lactate producing system">Lactate producing system</a> | ||
| + | </li> | ||
| + | <li> | ||
| + | <a href="https://2015.igem.org/Team:TJU/Results#Flavins producing system">Flavins producing system</a> | ||
| + | </li> | ||
| + | <li> | ||
| + | <a href="https://2015.igem.org/Team:TJU/Results#Co-culture MFC">Co-culture MFC</a> | ||
| + | </li> | ||
| + | </ul> | ||
| + | |||
</li> | </li> | ||
<li class="hmain"><a href="https://2015.igem.org/Team:TJU/Future Work">Future Work</a> | <li class="hmain"><a href="https://2015.igem.org/Team:TJU/Future Work">Future Work</a> | ||
| Line 180: | Line 192: | ||
<a href="https://static.igem.org/mediawiki/2015/2/20/QQ%E5%9B%BE%E7%89%8720150918005538.jpg" target="_blank"><img src=" https://static.igem.org/mediawiki/2013/9/90/Enlarge.jpg " width="20" height="20" align="right" alt="" /></a></p></div></div></br> | <a href="https://static.igem.org/mediawiki/2015/2/20/QQ%E5%9B%BE%E7%89%8720150918005538.jpg" target="_blank"><img src=" https://static.igem.org/mediawiki/2013/9/90/Enlarge.jpg " width="20" height="20" align="right" alt="" /></a></p></div></div></br> | ||
| − | <p>As shown in figure | + | <p>As shown in figure 4, <span style="font-style: italic">E. coli</span> BL21 with EC10 reaches a final yield of 17 mg/L in flask cultivation. <span style="font-style: italic">E. coli</span> BL21Δ<span style="font-style: italic">pgi</span> + EC10 reaches 33 mg/L. <span style="font-style: italic">E. coli</span> BL21 + EC10* reaches 90 mg/L.</p></br> |
<div class="kuang" style="width:590px"> | <div class="kuang" style="width:590px"> | ||
| Line 188: | Line 200: | ||
<a href="https://static.igem.org/mediawiki/2015/2/25/Ribo-4.png" target="_blank"><img src=" https://static.igem.org/mediawiki/2013/9/90/Enlarge.jpg " width="20" height="20" align="right" alt="" /></a></p></div></div></br> | <a href="https://static.igem.org/mediawiki/2015/2/25/Ribo-4.png" target="_blank"><img src=" https://static.igem.org/mediawiki/2013/9/90/Enlarge.jpg " width="20" height="20" align="right" alt="" /></a></p></div></div></br> | ||
| − | <a name="Co-culture MFC" id="Co-culture MFC"></a><h3> 3 Co-culture MFC -- <span style="font-style: normal; color:#ddbf73;"> | + | <a name="Co-culture MFC" id="Co-culture MFC"></a><h3> 3 Co-culture MFC -- <span style="font-style: normal; color:#ddbf73;">Division Of Labor</span> </h3> <hr></br> |
<div class="kuang" style="width:770px"> | <div class="kuang" style="width:770px"> | ||
| − | </br><a href="https://static.igem.org/mediawiki/2015/ | + | </br><a href="https://static.igem.org/mediawiki/2015/c/c1/Result_5'.png" target="_blank" ><img src= "https://static.igem.org/mediawiki/2015/c/c1/Result_5'.png" width="750" alt=""/></a> |
<div id="Enlarge"> | <div id="Enlarge"> | ||
<p> <b>Figure 5.</b> <span style="font-size: 14px"> The electrical output of MFCs of single strain <span style="font-style: italic">Shewanella oneidensis</span> MR-1 with different substrates.</span> | <p> <b>Figure 5.</b> <span style="font-size: 14px"> The electrical output of MFCs of single strain <span style="font-style: italic">Shewanella oneidensis</span> MR-1 with different substrates.</span> | ||
| − | <a href="https://static.igem.org/mediawiki/2015/ | + | <a href="https://static.igem.org/mediawiki/2015/c/c1/Result_5'.png" target="_blank"><img src=" https://static.igem.org/mediawiki/2013/9/90/Enlarge.jpg " width="20" height="20" align="right" alt="" /></a></p></div></div></br> |
<p>From the diagram above, we demonstrate that:</p> | <p>From the diagram above, we demonstrate that:</p> | ||
| Line 205: | Line 217: | ||
</br><a href="https://static.igem.org/mediawiki/2015/f/f9/Result_6.png" target="_blank" ><img src= "https://static.igem.org/mediawiki/2015/f/f9/Result_6.png" width="750" alt=""/></a> | </br><a href="https://static.igem.org/mediawiki/2015/f/f9/Result_6.png" target="_blank" ><img src= "https://static.igem.org/mediawiki/2015/f/f9/Result_6.png" width="750" alt=""/></a> | ||
<div id="Enlarge"> | <div id="Enlarge"> | ||
| − | <p> <b>Figure 6.</b> <span style="font-size: 14px"> The electrical output of co-culture MFCs with preliminary | + | <p> <b>Figure 6.</b> <span style="font-size: 14px"> The electrical output of co-culture MFCs with preliminary division of labor</span> |
<a href="https://static.igem.org/mediawiki/2015/f/f9/Result_6.png" target="_blank"><img src=" https://static.igem.org/mediawiki/2013/9/90/Enlarge.jpg " width="20" height="20" align="right" alt="" /></a></p></div></div></br> | <a href="https://static.igem.org/mediawiki/2015/f/f9/Result_6.png" target="_blank"><img src=" https://static.igem.org/mediawiki/2013/9/90/Enlarge.jpg " width="20" height="20" align="right" alt="" /></a></p></div></div></br> | ||
| Line 216: | Line 228: | ||
<div class="kuang" style="width:770px"> | <div class="kuang" style="width:770px"> | ||
| − | </br><a href="https://static.igem.org/mediawiki/2015/ | + | </br><a href="https://static.igem.org/mediawiki/2015/0/01/Result_00.png" target="_blank" ><img src= "https://static.igem.org/mediawiki/2015/0/01/Result_00.png" width="750" alt=""/></a> |
<div id="Enlarge"> | <div id="Enlarge"> | ||
| − | <p> <b>Figure | + | <p> <b>Figure 7.</b> <span style="font-size: 14px"> The electrical output of co-culture MFCs with optimized division of labor and bacteria proportion.</span> |
| − | <a href="https://static.igem.org/mediawiki/2015/ | + | <a href="https://static.igem.org/mediawiki/2015/0/01/Result_00.png" target="_blank"><img src=" https://static.igem.org/mediawiki/2013/9/90/Enlarge.jpg " width="20" height="20" align="right" alt="" /></a></p></div></div></br> |
<p>The maximal potential increased up to 322 mV and could maintain for 30 hours in the optimized three-strain system. (consist of <span style="font-style: italic">Shewanella</span> and two kinds of <span style="font-style: italic">E. coli</span>)</p></br> | <p>The maximal potential increased up to 322 mV and could maintain for 30 hours in the optimized three-strain system. (consist of <span style="font-style: italic">Shewanella</span> and two kinds of <span style="font-style: italic">E. coli</span>)</p></br> | ||
| Line 226: | Line 238: | ||
</br><a href="https://static.igem.org/mediawiki/2015/3/3b/Result_8%27.png" target="_blank" ><img src= "https://static.igem.org/mediawiki/2015/3/3b/Result_8%27.png" width="750" alt=""/></a> | </br><a href="https://static.igem.org/mediawiki/2015/3/3b/Result_8%27.png" target="_blank" ><img src= "https://static.igem.org/mediawiki/2015/3/3b/Result_8%27.png" width="750" alt=""/></a> | ||
<div id="Enlarge"> | <div id="Enlarge"> | ||
| − | <p> <b>Figure | + | <p> <b>Figure 8.</b> <span style="font-size: 14px"> The electrical output of co-culture system with fermentation bacteria added 8h later into the system</span> |
<a href="https://static.igem.org/mediawiki/2015/3/3b/Result_8%27.png" target="_blank"><img src=" https://static.igem.org/mediawiki/2013/9/90/Enlarge.jpg " width="20" height="20" align="right" alt="" /></a></p></div></div></br> | <a href="https://static.igem.org/mediawiki/2015/3/3b/Result_8%27.png" target="_blank"><img src=" https://static.igem.org/mediawiki/2013/9/90/Enlarge.jpg " width="20" height="20" align="right" alt="" /></a></p></div></div></br> | ||
| − | |||
| − | Figure 12 | + | <div class="kuang" style="width:770px"> |
| − | <p>The relations between current density and voltage is referred as polarization curve while the power curve can represent the relations between output power density and current density. We can learn from the | + | </br><a href="https://static.igem.org/mediawiki/2015/6/6d/Result_12%27.png" target="_blank" ><img src= "https://static.igem.org/mediawiki/2015/6/6d/Result_12%27.png" width="750" alt=""/></a> |
| + | <div id="Enlarge"> | ||
| + | <p> <b>Figure 12.</b> <span style="font-size: 14px"> a | ||
| + | (1) A series of voltage brought by different external resistance from <span style="font-style: italic">Shewanella</span> + Δ<span style="font-style: italic">pflB</span> <span style="font-style: italic">ldhE</span> + Rf02S MFC system | ||
| + | (2)The polarization curve and power density of <span style="font-style: italic">Shewanella</span> + Δ<span style="font-style: italic">pflB</span> <span style="font-style: italic">ldhE</span> + Rf02S MFC system. | ||
| + | Besides, the highest power density can reach to 10mW/m<sup>2</sup>. | ||
| + | b | ||
| + | (1)A series of voltage brought by different external resistance from <span style="font-style: italic">Shewanella</span> + Δ<span style="font-style: italic">pflB</span> <span style="font-style: italic">ldhE</span> + <span style="font-style: italic">B. subtilis</span> | ||
| + | (2)The polarization curve and power density of <span style="font-style: italic">Shewanella</span> + Δ<span style="font-style: italic">pflB</span> <span style="font-style: italic">ldhE</span> + <span style="font-style: italic">B. subtilis</span> MFC system. | ||
| + | </span> | ||
| + | <a href="https://static.igem.org/mediawiki/2015/6/6d/Result_12%27.png" target="_blank"><img src=" https://static.igem.org/mediawiki/2013/9/90/Enlarge.jpg " width="20" height="20" align="right" alt="" /></a></p></div></div></br> | ||
| + | |||
| + | <p>The relations between current density and voltage is referred as polarization curve while the power curve can represent the relations between output power density and current density. We can learn from the figure 13, the highest power density of (1) reaches 10 mW/m<sup>2</sup> and (2) reaches 17 mW/m<sup>2</sup>.</p></br> | ||
| + | |||
| − | |||
<div class="kuang" style="width:770px"> | <div class="kuang" style="width:770px"> | ||
| − | </br><a href="https://static.igem.org/mediawiki/2015/ | + | </br><a href="https://static.igem.org/mediawiki/2015/3/31/Result_13%27.png" target="_blank" ><img src= "https://static.igem.org/mediawiki/2015/3/31/Result_13%27.png" width="750" alt=""/></a> |
<div id="Enlarge"> | <div id="Enlarge"> | ||
| − | <p> <b>Figure 13.</b> <span style="font-size: 14px">(a) The comparison of polarization curve and power curve among <span style="font-style: italic">Shewanella</span>, <span style="font-style: italic">Shewanella</span> + MG1655, <span style="font-style: italic">Shewanella</span> + Δ<span style="font-style: italic"> | + | <p> <b>Figure 13.</b> <span style="font-size: 14px">(a) The comparison of polarization curve and power curve among <span style="font-style: italic">Shewanella</span>, <span style="font-style: italic">Shewanella</span> + MG1655, <span style="font-style: italic">Shewanella</span> + Δ<span style="font-style: italic">pflB</span> <span style="font-style: italic">ldhE</span> + Rf02S. |
| − | (b)The comparison of polarization curve and power curve among <span style="font-style: italic">Shewanella</span>, <span style="font-style: italic">Shewanella</span> + MG1655 and <span style="font-style: italic">Shewanella</span> + Δ<span style="font-style: italic"> | + | (b)The comparison of polarization curve and power curve among <span style="font-style: italic">Shewanella</span>, <span style="font-style: italic">Shewanella</span> + MG1655 and <span style="font-style: italic">Shewanella</span> + Δ<span style="font-style: italic">pflB</span> <span style="font-style: italic">ldhE</span> + <span style="font-style: italic">B. Subtilis</span>. |
</span> | </span> | ||
| − | <a href="https://static.igem.org/mediawiki/2015/ | + | <a href="https://static.igem.org/mediawiki/2015/3/31/Result_13%27.png" target="_blank"><img src=" https://static.igem.org/mediawiki/2013/9/90/Enlarge.jpg " width="20" height="20" align="right" alt="" /></a></p></div></div></br> |
| − | <p>It is obvious that the power output in three-strain MFC systems with a more complete | + | <p>It is obvious that the power output in three-strain MFC systems with a more complete division of labor are far greater than single-strain and two-strian MFCs.</p></br> |
| + | It significantly improves the commensalism relations between electricigens and fermentation bacteria.</p></br> | ||
| − | |||
<div class="kuang" style="width:770px"> | <div class="kuang" style="width:770px"> | ||
| − | </br><a href="https://static.igem.org/mediawiki/2015/ | + | </br><a href="https://static.igem.org/mediawiki/2015/d/d5/Result_14%27.png" target="_blank" ><img src= "https://static.igem.org/mediawiki/2015/d/d5/Result_14%27.png" width="750" alt=""/></a> |
<div id="Enlarge"> | <div id="Enlarge"> | ||
| − | <p> <b>Figure 14.</b> <span style="font-size: 14px"> The comparison of polarization curve and power curve among <span style="font-style: italic">Shewanella</span> + Δ<span style="font-style: italic"> | + | <p> <b>Figure 14.</b> <span style="font-size: 14px"> The comparison of polarization curve and power curve among <span style="font-style: italic">Shewanella</span> + Δ<span style="font-style: italic">pflB</span> <span style="font-style: italic">ldhE</span> + <span style="font-style: italic">B. Subtilis</span> and <span style="font-style: italic">Shewanella</span> + Δ<span style="font-style: italic">pflB</span> <span style="font-style: italic">ldhE</span> + Rf02S.</span> |
| − | <a href="https://static.igem.org/mediawiki/2015/ | + | <a href="https://static.igem.org/mediawiki/2015/d/d5/Result_14%27.png" target="_blank"><img src=" https://static.igem.org/mediawiki/2013/9/90/Enlarge.jpg " width="20" height="20" align="right" alt="" /></a></p></div></div></br> |
| − | + | ||
| − | + | ||
| Line 261: | Line 282: | ||
| − | + | </div><!--END OF body-PART-r--> | |
<div id="foot"><p>E-mail: ggjyliuyue@gmail.com |Address: Building No.20, No.92 Weijin road, Tianjin University, China | Zip-cod: 300072</br> | <div id="foot"><p>E-mail: ggjyliuyue@gmail.com |Address: Building No.20, No.92 Weijin road, Tianjin University, China | Zip-cod: 300072</br> | ||
</p> | </p> | ||
<p>Copyright 2015@TJU iGEM Team</p></div> | <p>Copyright 2015@TJU iGEM Team</p></div> | ||
</div> | </div> | ||
| − | + | ||
</div><!--END OF contain--> | </div><!--END OF contain--> | ||
| + | </html> | ||
Latest revision as of 14:03, 16 November 2015


Results
1 Lactate producing system
In order to verify our ldhE part and pflB knockout strategy have works well, we get following results.

Figure 1. a: The growth curve in anaerobic condition (M9 medium). b: Glucose consumption curve in anaerobic condition (M9 medium).
![]()
Shown as figure 1a, under anaerobic conditions, wild-type MG1655 has the same growth rate as MG1655ΔpflB, but MG1655ΔpflB + ldhE keeps relatively lower growth rate than the two strains mentioned before. Shown as figure 1b, the anaerobic glucose consumption rate keeps the nearly same among MG1655, MG1655ΔpflB and MG1655ΔpflB + ldhE.
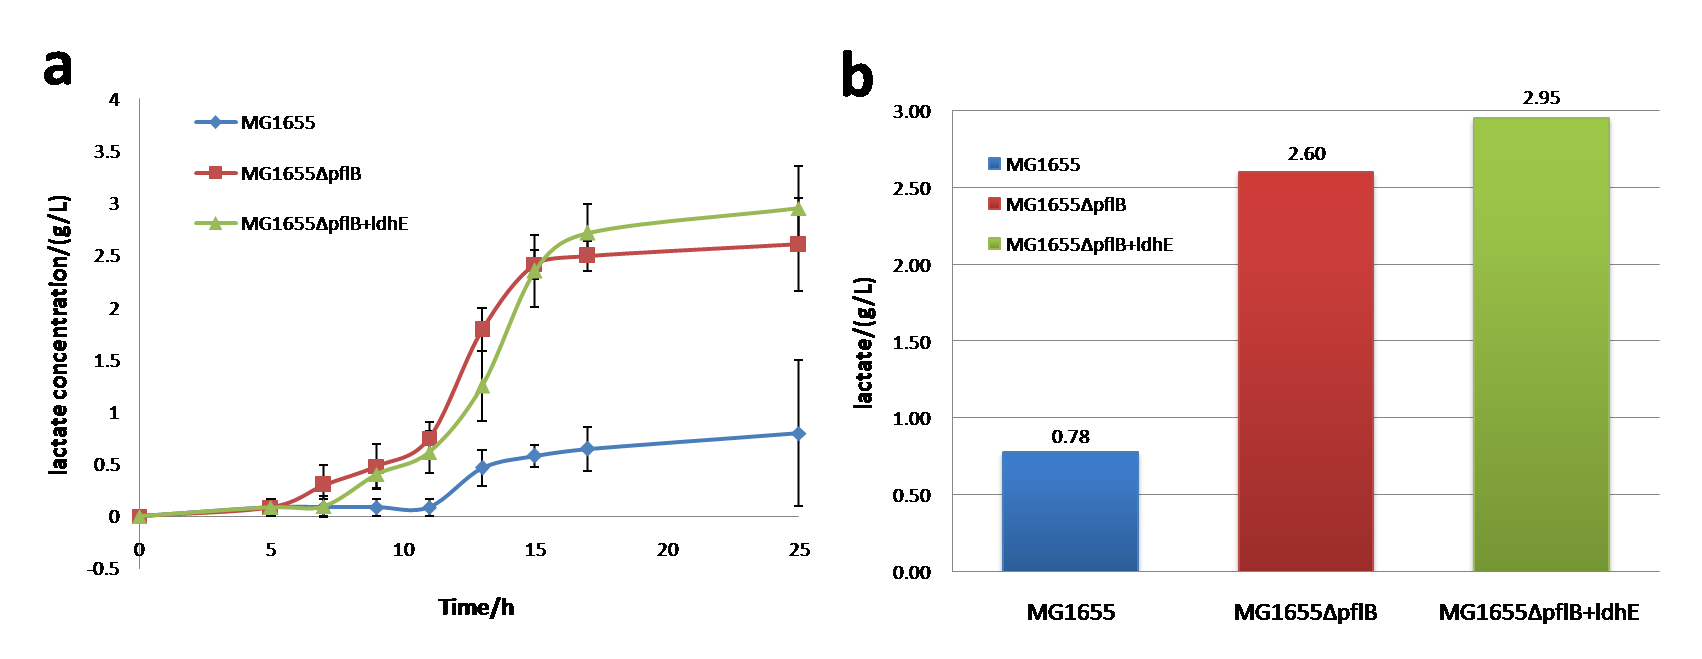
Figure 2. a: The lactate production curve in anaerobic condition (M9 medium). b: The lactate production in anaerobic condition (M9 medium, 25h after inoculation)
![]()
In anaerobic environment, lactate production of MG1655, MG1655ΔpflB and MG1655ΔpflB+ldhE has large differences between each other. Notably, knocking out of pflB together with ldhE insertion will increase lactate generation up to ~3 g/L and the amount produced by MG1655ΔpflB is smaller than MG1655ΔpflB+ldhE.
So, knocking out of pflB can dramatically improve the lactate production. Besides, ldhE also plays an important role in lactate increase. Engineered lactate producing strain (MG1655ΔpflB+ldhE) has a greater utilization of carbon sources and a higher yield of lactate with M9 medium under the same concentrations of glucose.
2 Flavins producing system
To prove the EC10 and EC10* work as expected, we conduct several experiments and the results are as follows.

Figure 3. The yield of riboflavin in different strains: EC10, Rf02S (Δpgi + EC10), EC10*
![]()
As shown in figure 4, E. coli BL21 with EC10 reaches a final yield of 17 mg/L in flask cultivation. E. coli BL21Δpgi + EC10 reaches 33 mg/L. E. coli BL21 + EC10* reaches 90 mg/L.

Figure 4. The yield of riboflavin in different strains :EC10, Rf02S (Δpgi+EC10), EC10*
![]()
3 Co-culture MFC -- Division Of Labor

Figure 5. The electrical output of MFCs of single strain Shewanella oneidensis MR-1 with different substrates.
![]()
From the diagram above, we demonstrate that:
1. Shewanella cannot use glucose as a mere carbon substrate to generate power and so the potential keeps no more than 50 mV.
2. Shewanella can produce the maximal potential up to 150mV with supplement of sodium lactate.
3. Shewanella can produce even higher potential when we take sodium lactate as the carbon source and add little riboflavin into the system.
Conclusion: According to our experiment, our system is feasible in principle. Lactate can serve as the entry point in material flow and riboflavin as the major factor in energy and information flow, which lays a foundation in the later experiment design. We can use fermentation bacteria to provide carbon sources and electron shuttles, which subsequently, will increase the power generation capability in the co-culture system.
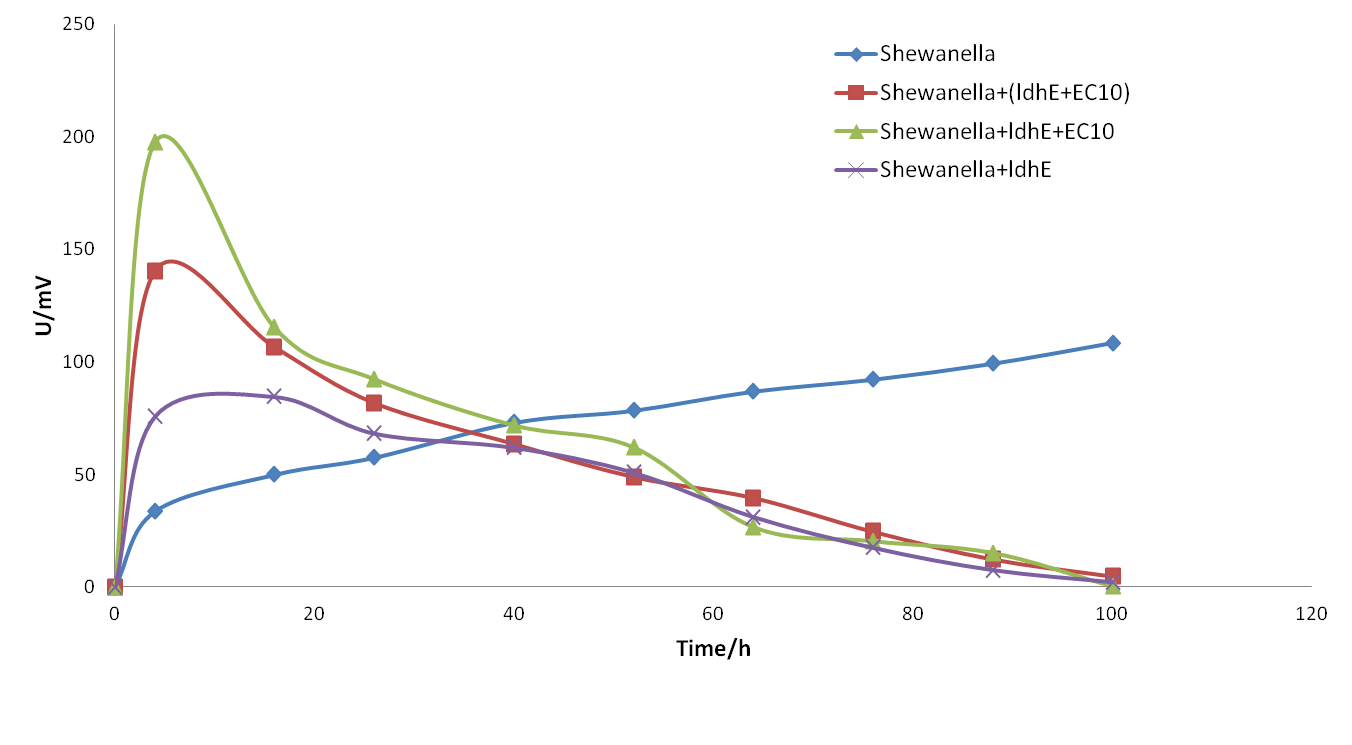
Figure 6. The electrical output of co-culture MFCs with preliminary division of labor
![]()
Description: The results show that dividing material, energy and information flow into separated fermentation bacteria is much better than combining the two tasks into one kind of bacteria. We suppose that the production of riboflavins and lactate cannot be consistent in single strain because lactate is the primary metabolites and riboflavin is the secondary.
However, the electricity output cannot sustain for long and decrease promptly (as shown in figure 5).Based on the measurement, samples from anode reaches an excessively low pH (lower than 6.2) which might not meet the survival requirement of Shewanella.
To optimize the system, we try to control the rate of lactate production and adjust the proportion of fermentation bacteria.

Figure 7. The electrical output of co-culture MFCs with optimized division of labor and bacteria proportion.
![]()
The maximal potential increased up to 322 mV and could maintain for 30 hours in the optimized three-strain system. (consist of Shewanella and two kinds of E. coli)

Figure 8. The electrical output of co-culture system with fermentation bacteria added 8h later into the system
![]()

Figure 12. a
(1) A series of voltage brought by different external resistance from Shewanella + ΔpflB ldhE + Rf02S MFC system
(2)The polarization curve and power density of Shewanella + ΔpflB ldhE + Rf02S MFC system.
Besides, the highest power density can reach to 10mW/m2.
b
(1)A series of voltage brought by different external resistance from Shewanella + ΔpflB ldhE + B. subtilis
(2)The polarization curve and power density of Shewanella + ΔpflB ldhE + B. subtilis MFC system.
![]()
The relations between current density and voltage is referred as polarization curve while the power curve can represent the relations between output power density and current density. We can learn from the figure 13, the highest power density of (1) reaches 10 mW/m2 and (2) reaches 17 mW/m2.

Figure 13. (a) The comparison of polarization curve and power curve among Shewanella, Shewanella + MG1655, Shewanella + ΔpflB ldhE + Rf02S.
(b)The comparison of polarization curve and power curve among Shewanella, Shewanella + MG1655 and Shewanella + ΔpflB ldhE + B. Subtilis.
![]()
It is obvious that the power output in three-strain MFC systems with a more complete division of labor are far greater than single-strain and two-strian MFCs.
It significantly improves the commensalism relations between electricigens and fermentation bacteria.
Figure 14. The comparison of polarization curve and power curve among Shewanella + ΔpflB ldhE + B. Subtilis and Shewanella + ΔpflB ldhE + Rf02S.
![]()
E-mail: ggjyliuyue@gmail.com |Address: Building No.20, No.92 Weijin road, Tianjin University, China | Zip-cod: 300072
Copyright 2015@TJU iGEM Team