Difference between revisions of "Team:TJU/Modeling"
| Line 10: | Line 10: | ||
#body-PART{width:1100px;margin-left:auto;margin-right:auto;height:auto;background-color: #FFF;} | #body-PART{width:1100px;margin-left:auto;margin-right:auto;height:auto;background-color: #FFF;} | ||
#body-PART-head{width:1100px;background-color:#FFF;font-family: "Lucida Grande", "Lucida Sans Unicode", "Lucida Sans", "DejaVu Sans", Verdana, sans-serif;color:rgba(204,204,255,1);font-size: 50px;float: left;text-align:center} | #body-PART-head{width:1100px;background-color:#FFF;font-family: "Lucida Grande", "Lucida Sans Unicode", "Lucida Sans", "DejaVu Sans", Verdana, sans-serif;color:rgba(204,204,255,1);font-size: 50px;float: left;text-align:center} | ||
| − | #body-PART-l{width:22.2%;height: | + | #body-PART-l{width:22.2%;height:15650px;background-color:#FFF;float:left;} |
#body-PART-r{width:76.8%;height:auto;background-color:#FFF;float:left;margin-top:10px;margin-left:1%;text-align: justify;font-size:16px;font-family:Arial;line-height:150%;} | #body-PART-r{width:76.8%;height:auto;background-color:#FFF;float:left;margin-top:10px;margin-left:1%;text-align: justify;font-size:16px;font-family:Arial;line-height:150%;} | ||
h2{font-family:Arial;color:#006;font-size:40px;align:center} | h2{font-family:Arial;color:#006;font-size:40px;align:center} | ||
| Line 35: | Line 35: | ||
<div id ="contain"> | <div id ="contain"> | ||
| − | <div id="header-2"><img src="https://static.igem.org/mediawiki/2015/ | + | <div id="header-2"><img src="https://static.igem.org/mediawiki/2015/3/3a/Modeling_9.15.jpg" width="1100px" alt=""/></div> |
<div id="body-PART"> | <div id="body-PART"> | ||
<div id="body-PART-l"> | <div id="body-PART-l"> | ||
| Line 50: | Line 50: | ||
$(window).scroll(function(e){ | $(window).scroll(function(e){ | ||
s = $(document).scrollTop(); | s = $(document).scrollTop(); | ||
| − | if(s > t - | + | if(s > t - 70){ |
$('.fixed').css('position','fixed'); | $('.fixed').css('position','fixed'); | ||
| − | if(s + fh - | + | if(s + fh - 18000 > mh){ |
$('.fixed').css('top',mh-s-fh+'px'); | $('.fixed').css('top',mh-s-fh+'px'); | ||
} | } | ||
| Line 85: | Line 85: | ||
}); | }); | ||
</script> | </script> | ||
| − | |||
<div class="cont"> | <div class="cont"> | ||
<ul> | <ul> | ||
| − | |||
| − | |||
| − | |||
<li class="hmain"> | <li class="hmain"> | ||
| − | + | <a href="#Gene Expression Model for Lactate production">Gene Expression Model for Lactate production</a> | |
| − | + | <ul> | |
<li> | <li> | ||
| − | + | <a href="#Simplification and Assumption1">Simplification and Assumption</a> | |
</li> | </li> | ||
<li> | <li> | ||
| − | + | <a href="#Equation Establishment1">Equation Establishment</a> | |
</li> | </li> | ||
| − | + | <li> | |
| − | + | <a href="#Simulation Results1">Simulation Results</a> | |
</li> | </li> | ||
| + | </ul> | ||
| + | </li> | ||
| + | <li class="hmain" > | ||
| + | <a href="#Models for monocultures of Shewanella in MFC">Models for monocultures of <em>Shewanella</em> in MFC</a> | ||
| + | <ul> | ||
<li> | <li> | ||
| − | + | <a href="#Shewanella Growth Model">Simplification and Assumption</a> | |
| + | </li> | ||
| + | <li> | ||
| + | <a href="#Extracellular Electron Transfer Model">Equation Establishment</a> | ||
</li> | </li> | ||
| − | |||
| − | |||
| − | |||
| − | |||
| − | |||
| − | |||
| − | |||
<li> | <li> | ||
| − | + | <a href="#Simulation Results2">Simulation Results</a> | |
</li> | </li> | ||
<li> | <li> | ||
| − | + | <a href="#Parameters and variables2">Parameters and variables</a> | |
| − | </li> | + | </li> |
| + | </ul> | ||
| + | </li> | ||
| + | <li class="hmain" > | ||
| + | <a href="#Models for monocultures of Shewanella in MFC">Model for co-culture MFC</a> | ||
| + | <ul> | ||
| + | <li> | ||
| + | <a href="#Growth Model of E.coli">Growth Model of <em>E.coli</em></a> | ||
| + | </li> | ||
<li> | <li> | ||
| − | + | <a href="#Extracellular Electron Transfer Model">Equation Establishment</a> | |
</li> | </li> | ||
| − | + | <li> | |
| − | + | <a href="#Simulation Results3">Simulation Results</a> | |
| − | + | ||
| − | + | ||
| − | + | ||
| − | + | ||
| − | + | ||
| − | + | ||
</li> | </li> | ||
<li> | <li> | ||
| − | + | <a href="#Parameters and variables3">Parameters and variables</a> | |
| + | </li> | ||
| + | </ul> | ||
| + | </li> | ||
| + | <li class="hmain" > | ||
| + | <a href="#Model for P170 promoter">Model for P170 promoter</a> | ||
| + | <ul> | ||
| + | <li> | ||
| + | <a href="#Introduction">Introduction</a> | ||
| + | </li> | ||
| + | <li> | ||
| + | <a href="#Assumptions">Assumptions</a> | ||
| + | </li> | ||
| + | <li> | ||
| + | <a href="#Equation Establishment4">Equation Establishment</a> | ||
| + | </li> | ||
| + | <li> | ||
| + | <a href="#Simulation Results4">Simulation Results</a> | ||
</li> | </li> | ||
| − | + | <li> | |
| − | + | <a href="#Parameters and variables4">Parameters and variables</a> | |
| − | <li> <a href="https://2015.igem.org" ></br></br></br></br><img src="https://static.igem.org/mediawiki/2015/1/1a/TJU_main.png" width="200" border="none" /></a> | + | </li> |
| + | </ul> | ||
| + | </li> | ||
| + | <li> | ||
| + | <a href="https://2015.igem.org" ></br></br></br></br><img src= "https://static.igem.org/mediawiki/2015/1/1a/TJU_main.png" width="200" border="none" /></a> | ||
</li> | </li> | ||
</ul> | </ul> | ||
| Line 145: | Line 165: | ||
<div id="body-PART-r" > | <div id="body-PART-r" > | ||
| − | |||
| − | |||
| − | |||
| − | |||
| − | |||
| − | |||
| − | |||
| − | |||
| − | |||
| − | |||
| − | |||
| − | |||
| − | |||
| − | |||
| − | < | + | <!--此处为Gene Expression Model for Lactate production 部分--> |
| − | + | ||
| − | + | <a name="Gene Expression Model for Lactate production" id="Gene Expression Model for Lactate production"></a><h3></br>1 Gene Expression Model for Lactate production </h3> <hr></br> | |
| − | + | ||
| − | + | ||
| − | + | ||
| − | + | ||
| − | + | ||
| − | + | <a name="Simplification and Assumption" id="Simplification and Assumption1"></a><p><span style="font-style: normal; font-weight: bold; color:#ddbf73;">Simplification and Assumption</span></p> | |
| − | + | ||
| − | + | ||
| − | <p | + | <p align="justify">① Simplifications and assumptions for metabolic pathway and gene insertion:supposing that we have adequate glucose and constant pyruvate, the latter used to product lactate can be replenished by glucose in <em>E.coli</em>. Naturally, <em>E.coli</em> can itself |
| − | + | produce lactate dehydrogenase (ldh) through ldhA gene expression. Later, we attempt to introduce plasmids with ldh gene, which can produce the extra ldh as an approach to generate even more lactate. However, the excessive ldh, to a certain degree, will also inhibit ldh gene expression.</p> | |
| − | <p> | + | <p align="justify">② Simplifications and assumptions for Michaelis-Menten equation: we want to figure out the relations between the speed of lactate production and the amount of ldh expression. But, there is a precondition in Michaelis-Menten equation, namely, the total amount of enzyme in solution keeps unchanged.</p> |
| + | <p align="left">So, we need to modify the existing Michaelis-Menten equation:</p> | ||
| + | </br> | ||
| + | <table width="840" border="0" cellspacing="0"> | ||
| + | <tr> | ||
| + | <td align="left" width="126"> </td> | ||
| + | <td align="center" width="588"><img src= "https://static.igem.org/mediawiki/2015/9/93/TJU_Modeling1.JPG" width="300" alt=""/></td> | ||
| + | <td align="right" width="126"> </td> | ||
| + | </tr> | ||
| + | </table> | ||
| + | </br> | ||
| + | <p align="justify">The above equation reflects a general enzyme catalytic reaction process. With the help of steady state approximation, the equation can transform from first-order reaction to zero-order reaction. Because of the constant substrate concentration as we assumed, the variable in the equation is the variation of ldh amount, which means that the independent variable in the Michaelis-Menten equation turns into the enzyme amount. (variable change from [S] into [E])</p> | ||
| + | </br> | ||
| + | <table width="840" border="0" cellspacing="0"> | ||
| + | <tr> | ||
| + | <td align="left" width="126"> </td> | ||
| + | <td align="center" width="588"><img src="https://static.igem.org/mediawiki/2015/7/78/TJU_Modeling2.JPG" width="160" alt=""/></td> | ||
| + | <td align="right" width="126"> </td> | ||
| + | </tr> | ||
| + | </table> | ||
| + | </br> | ||
| + | <table width="840" border="0" cellspacing="0"> | ||
| + | <tr> | ||
| + | <td align="left" width="126"><p>in which :</p></td> | ||
| + | <td align="center" width="294"><img src="https://static.igem.org/mediawiki/2015/4/49/TJU_Modeling3.JPG" width="80" alt=""/></td> | ||
| + | <td align="center" width="294"><img src="https://static.igem.org/mediawiki/2015/6/69/TJU_Modeling4.JPG" width="100" alt=""/></td> | ||
| + | <td align="right" width="126"><p>(1)</p></td> | ||
| + | </tr> | ||
| + | </table> | ||
| + | </br> | ||
| − | <p> | + | <p>③ Simplification of transmembrane transfer: the original pH in the medium is slightly greater than 7 and the pH can keep constant with the buffer function of KHPO4 together with KH2PO4. Suppose that <em><em>Shewanella</em></em> can absorb lactate brought by <em>E.coli</em> timely, thus, pH can remain stable, which is around 7.2 based on our hypothesis. Further, we assume that transmembrane transfer belongs to codiffusion where the concentration difference of H+ and acid groups can drive the whole process. Therefore, the transmembrane transfer is only related to the intra membrane concentration of H+ and acid groups.</p> |
| − | <div class="kuang" | + | </br> |
| − | </br><a href="https://static.igem.org/mediawiki/2015/ | + | <a name="Equation Establishment" id="Equation Establishment1"></a><p><span style="font-style: normal; font-weight: bold; color:#ddbf73;">Equation Establishment</span></p> |
| + | <p align="justify">Firstly, we establish the equation of ldh amount changing with time. The following equations represent the ldh production rate in <em>E.coli</em> without the plasmid insertion and with the plasmid introduction, respectively.</p> | ||
| + | </br> | ||
| + | <table width="840" border="0" cellspacing="0"> | ||
| + | <tr> | ||
| + | <td align="left" width="126"> </td> | ||
| + | <td align="center" width="588"><img src="https://static.igem.org/mediawiki/2015/0/06/TJU_Modeling5.JPG" width="200" alt=""/></td> | ||
| + | <td align="right" width="126"><p>(2)</p></td> | ||
| + | </tr> | ||
| + | <tr> | ||
| + | <td align="left" width="126"> </td> | ||
| + | <td align="center" width="588"><img src="https://static.igem.org/mediawiki/2015/a/a6/TJU_Modeling6.JPG" width="220" alt=""/></td> | ||
| + | <td align="right" width="126"><p>(3)</p></td> | ||
| + | </tr> | ||
| + | </table> | ||
| + | </br> | ||
| + | <p align="left">Next, we construct the lactate production rate equation:</p> | ||
| + | </br> | ||
| + | <table width="840" border="0" cellspacing="0"> | ||
| + | <tr> | ||
| + | <td align="left" width="126"> </td> | ||
| + | <td align="center" width="588"><img src="https://static.igem.org/mediawiki/2015/7/77/TJU_Modeling7.JPG" width="300" alt=""/></td> | ||
| + | <td align="right" width="126">(4)</td> | ||
| + | </tr> | ||
| + | </table> | ||
| + | </br> | ||
| + | <p align="justify">Finally, the lactate transmembrane transfer equations has been figured out. It shows that lactate will be transferred to the outside at the time it produced. We represent the intra membrane with c and extra membrane with e.</p> | ||
| + | </br> | ||
| + | <table width="840" border="0" cellspacing="0"> | ||
| + | <tr> | ||
| + | <td align="left" width="126"> </td> | ||
| + | <td align="center" width="588"><img src="https://static.igem.org/mediawiki/2015/4/47/TJU_Modeling8.JPG" width="300" alt=""/></td> | ||
| + | <td align="right" width="126"> </td> | ||
| + | </tr> | ||
| + | </table> | ||
| + | </br> | ||
| + | <p align="left">The transmembrane transfer rate:</p> | ||
| + | </br> | ||
| + | <table width="840" border="0" cellspacing="0"> | ||
| + | <tr> | ||
| + | <td align="left" width="126"> </td> | ||
| + | <td align="center" width="588"><img src=" https://static.igem.org/mediawiki/2015/1/11/TJU_Modeling9.JPG" width="350" alt=""/></td> | ||
| + | <td align="right" width="126"><p>(5)</p></td> | ||
| + | </tr> | ||
| + | </table> | ||
| + | </br> | ||
| + | <p align="left">When lactate production is combined with its transfer, we can get the following equation:</p> | ||
| + | </br> | ||
| + | <table width="840" border="0" cellspacing="0"> | ||
| + | <tr> | ||
| + | <td align="left" width="126"> </td> | ||
| + | <td align="center" width="588"><img src="https://static.igem.org/mediawiki/2015/f/f3/TJU_Modeling10.JPG" width="400" alt=""/></td> | ||
| + | <td align="right" width="126"><p>(6)</p></td> | ||
| + | </tr> | ||
| + | </table> | ||
| + | </br> | ||
| + | |||
| + | </br> | ||
| + | <a name="Simulation Results" id="Simulation Results1"><p><span style="font-style: normal; font-weight: bold; color:#ddbf73;">Simulation Results</p> | ||
| + | <div class="kuang" style="width:470px"> | ||
| + | </br><a href="https://static.igem.org/mediawiki/2015/b/b0/%E4%B9%B3%E9%85%B8.jpg" target="_blank" ><img src= "https://static.igem.org/mediawiki/2015/b/b0/%E4%B9%B3%E9%85%B8.jpg" width="450" alt=""/></a> | ||
<div id="Enlarge"> | <div id="Enlarge"> | ||
| − | <p | + | <p> <b>Figure 1.</b> <span style="font-size: 14px"> The relations between amount of ldh and lactate with time passed, respectively.</span> |
| − | + | <a href="https://static.igem.org/mediawiki/2015/b/b0/%E4%B9%B3%E9%85%B8.jpg" width="20" height="20" align="right" alt="" /></a></p></div></div></br> | |
| − | + | ||
| − | + | ||
| − | |||
| − | < | + | <!--此处为Gene Expression Model for Lactate production 部分--> |
| + | </br></br> | ||
| + | <!--此处为 Models for monocultures of <em>Shewanella</em> in MFC 部分--> | ||
| − | |||
| − | |||
| − | |||
| − | < | + | <a name="Models for monocultures of Shewanella in MFC" id="Models for monocultures of Shewanella in MFC"></a><h3>2 Models for monocultures of <em><em>Shewanella</em></em> in MFC </h3> <hr></br> |
| − | <p style="font-weight: | + | <p><a name="Shewanella Growth Model" id="Shewanella Growth Model"></a><span style="font-style: normal; font-weight: bold; color:#ddbf73;"><em>Shewanella</em> Growth Model Based on Carbon Balance</span></p> |
| − | <p> | + | <p align="justify">At the very beginning, we construct a fermentation kinetic model based on the Monod Equation to draw a picture of carbon balance between biomass increase and base consumption during <em>S.oneidensis</em> MR-1 growth. Before generation our modeling, we simplify the center process of carbon metabolism in <em>Shewanella</em> via making assumptions as follows:</p> |
| + | <p align="justify">① Lactate is the preferable carbon source for <em>Shewanella</em>. Lactate can transform into pyruvate by dehydrogenation, which then converts mostly into acetyl coenzyme. Subsequently, acetyl coenzyme can either be oxidized into CO2 and release energy by TCA Circle or transform into acetate.</p> | ||
| + | <p align="justify">② When there are too much lactate, the producing rate of acetyl coenzyme will be greater than the consuming rate of that in TCA circle. The excessive acetyl coenzyme will convert into acetate and release to the outside. Inversely, the shortage of lactate leads the utilization of acetate which then maintains the metabolism by acetyl coenzyme formation.</p> | ||
| + | <p align="justify">③ Although both acetate and lactate can be used as carbon sources for <em>Shewanella</em>, acetate can restrain its growth. On the one hand, acetate will drop the acidity inside the cell, which, a step forward, can affect the activity of enzyme in vivo resulted in uncompetitive inhibition to cell growth. On the other hand, acetate can itself limit the growth by uncompetitive inhibition. In particular, the process of acetate metabolism and lactate metabolism are competing for acetyl coenzyme, which reduces the lactate utilization and influences cell growth. (Tang & Meadows, 2006)</p> | ||
| + | <p align="justify">④ The redox of mediator in the outer membrane is the rate-limiting step of electron transfer chain in <em>Shewanella</em>. TCA circle, an important pathway for the synthesis of energy and biomass , largely depends on the concentration of electron receptor at the end of electron transfer chain. When there is a deficiency of oxidized mediator, TCA circle will be inhibited, thereby, affect the whole process of metabolism as well as biomass increase.</p> | ||
| + | </br> | ||
| + | <p align="justify">According to the four assumptions above along with acetate uncompetitive inhibition and competitive inhibition, we decide to use multi-substrates Monod equation(Blanch & Clark, 1997) with two kinds of inhibition to demonstrate the relations between restrictive substrates and biomass increase rate. Considering that the accumulation of NADH will remarkably affect metabolic process under anaerobic conditions, we add a product factor in the Monod equation reflecting metabolites inhibition function. μ<subs>L</subs> and μ<subs>A</subs> refers to the lactate and acetate biomass specific rate, respectively. We quantify the relations between specific rate of lactate/acetate and restrictive base concentration as following:</p> | ||
| + | </br> | ||
| + | <table width="840" border="0" cellspacing="0"> | ||
| + | <tr> | ||
| + | <td align="left" width="126"> </td> | ||
| + | <td align="center" width="588"><img src="https://static.igem.org/mediawiki/2015/e/ee/TJU_Modeling11.JPG" width="400" alt=""/></td> | ||
| + | <td align="right" width="126"><p>(7)</p></td> | ||
| + | </tr> | ||
| + | <tr> | ||
| + | <td align="left" width="126"> </td> | ||
| + | <td align="center" width="588"><img src="https://static.igem.org/mediawiki/2015/3/3c/TJU_Modeling12.JPG" width="400" alt=""/></td> | ||
| + | <td align="right" width="126">(8)</td> | ||
| + | </tr> | ||
| + | </table> | ||
| + | </br> | ||
| + | <p align="justify">Biomass, lactate and acetate concentration can vary with time and its construction depends on kinetic model which is based on the general kinetics of the fermentation process model. Consumption of lactate and acetate can be both used for biomass increase and endogenous metabolism maintenance. However, considering the rarely energy losses caused by metabolism in vivo, we ignore the carbon consumption brought by metabolism. In this way, lactate can only be used for biomass increase and acetate production while acetate is merely used for biomass increase.</p> | ||
| + | </br> | ||
| + | <table width="840" border="0" cellspacing="0"> | ||
| + | <tr> | ||
| + | <td align="left" width="126"> </td> | ||
| + | <td align="center" width="588"><img src="https://static.igem.org/mediawiki/2015/3/35/TJU_Modeling13.JPG" width="200" alt=""/></td> | ||
| + | <td align="right" width="126"><p>(9)</p></td> | ||
| + | </tr> | ||
| + | <tr> | ||
| + | <td align="left" width="126"> </td> | ||
| + | <td align="center" width="400"><img src="https://static.igem.org/mediawiki/2015/c/c8/TJU_Modeling14.JPG" width="200" alt=""/></td> | ||
| + | <td align="right" width="126"><p>(10)</p></td> | ||
| + | </tr> | ||
| + | <tr> | ||
| + | <td align="left" width="126"> </td> | ||
| + | <td align="center" width="588"><img src="https://static.igem.org/mediawiki/2015/e/e6/TJU_Modeling15.JPG" width="200" alt=""/></td> | ||
| + | <td align="right" width="126"><p>(11)</p></td> | ||
| + | </tr> | ||
| + | </table> | ||
| + | </br></br> | ||
| − | <p> | + | <p><a name="Extracellular Electron Transfer Model" id="Extracellular Electron Transfer Model"></a><span style="font-style: normal; font-weight: bold; color:#ddbf73;">Extracellular Electron Transfer Model</span><p> |
| − | ( | + | <p align="justify">Extracellular Electron Transfer (EET) process can deliver the electrons between electrode and cell membrane with mediating functions of redox active molecules including FMN and riboflavin. It can be subdivided into the oxidation of reduced mediator and reduction of oxidized mediator in electrode.</p></br> |
| + | <p align="justify">We establish a model kinetics of electrode process on the basis of Bulter-Volmer equation to illustrate the oxidation of reduced mediator in electrode. Firstly, we make several assumptions just like the following tips:</p> | ||
| + | <p align="justify">①Although both of FMN and riboflavin can serve as mediator in electrode redox, we only take riboflavin into consideration for simplification in the model.</p> | ||
| + | <p align="justify">② There are two kinds of EET pathway model for riboflavin mediating. One of these called single-electron transfer in which riboflavin acts as cofactor of MtrC protein and can be reduced into semiquinone (Sq) with the standard electrode potential of -260v. Another one is two-electron transfer where the dissociative riboflavin binds to outer membrane c-Cyts as a cofactor in the hydroquinone (Hq) form with shifted potential of -145v. Under conditions of the same electrode and concentration, the exchange current density of single-electron transfer is much high than that of two-electron transfer since enzymatic reaction can greatly decrease its activation energy. Therefore, we assumed that current generation reaction in anode mainly belongs to the single-electron transfer.</p> | ||
| + | <p align="justify">③Oxidation of Sq in electrode is the reversible first order reaction. The net rate for this kind of reaction is made up by the difference between oxidized rate of Sq and reduced rate of riboflavin in electrode.</p></br> | ||
| − | <div class="kuang" | + | <p align="left">Accordingly, current density in anode can be calculated by Bulter-Vlomer equation:</p> |
| − | </br><a href="https://static.igem.org/mediawiki/2015/ | + | </br> |
| + | <table width="840" border="0" cellspacing="0"> | ||
| + | <tr> | ||
| + | <td align="left" width="126"> </td> | ||
| + | <td align="center" width="588"><img src="https://static.igem.org/mediawiki/2015/3/39/TJU_Modeling41.JPG" width="180" alt=""/></td> | ||
| + | <td align="right" width="126"><p>(12)</p></td> | ||
| + | </tr> | ||
| + | </table> | ||
| + | </br> | ||
| + | <p align="left">Redox reaction rate constant can be calculated by Arrhenius equation:</p> | ||
| + | </br> | ||
| + | <table width="840" border="0" cellspacing="0"> | ||
| + | <tr> | ||
| + | <td align="left" width="126"> </td> | ||
| + | <td align="center" width="588"><img src="https://static.igem.org/mediawiki/2015/1/1e/TJU_Modeling19.JPG" width="180" alt=""/></td> | ||
| + | <td align="right" width="126"><p>(13)</p></td> | ||
| + | </tr> | ||
| + | <tr> | ||
| + | <td align="left" width="126"> </td> | ||
| + | <td align="center" width="588"><img src="https://static.igem.org/mediawiki/2015/d/db/TJU_Modeling20.JPG" width="180" alt=""/></td> | ||
| + | <td align="right" width="126"><p>(14)</p></td> | ||
| + | </tr> | ||
| + | </table> | ||
| + | </br></br> | ||
| + | <p align="justify">As for the reduction of oxidized mediator in outer membrane for <em>Shewanella</em>, we establish a kinetics of enzyme catalyzed reaction on the basis of Michaelis-Menten equation, accordingly.</p> | ||
| + | <p align="left">①Similarly, we also consider the single-electron transfer as the only pathway in vivo.</p> | ||
| + | <p align="justify">② In such single-electron transfer process, riboflavin reduction kinetics characteristics follows the general rules of enzymatic reaction.</p> | ||
| + | <p align="justify">③The reduction of riboflavin is related to the reducing state of OM c-Cyts heme center which is also the terminal of EET pathway. Due to the electrons brought by NADH or NADPH from respiration, we argue that the process of riboflavin reduction into Sq is coupled with NADH from respiration process.</p></br> | ||
| + | |||
| + | <p align="justify">Based on the assumptions above, we believe the respiration of OM riboflavin has something to do with its concentration and NADH production rate. According to the kinetics of enzyme catalyzed reaction, we use multi-substrates Michaelis-Menten equation to determine the whole process:</p> | ||
| + | </br> | ||
| + | <table width="840" border="0" cellspacing="0"> | ||
| + | <tr> | ||
| + | <td align="left" width="126"> </td> | ||
| + | <td align="center" width="558"><img src="https://static.igem.org/mediawiki/2015/e/e3/TJU_Modeling17.JPG" width="280" alt=""/></td> | ||
| + | <td align="right" width="126"><p>(15)</p></td> | ||
| + | </tr> | ||
| + | <tr> | ||
| + | <td align="left" width="126"> </td> | ||
| + | <td align="center" width="558"><img src="https://static.igem.org/mediawiki/2015/8/8f/TJU_Modeling16.JPG" width="750" alt=""/></td> | ||
| + | <td align="right" width="126"><p>(16)</p></td> | ||
| + | </tr> | ||
| + | <tr> | ||
| + | <td align="left" width="126"> </td> | ||
| + | <td align="center" width="558"><img src="https://static.igem.org/mediawiki/2015/9/91/TJU_Modeling18.JPG" width="680" alt=""/></td> | ||
| + | <td align="right" width="126"><p>(17)</p></td> | ||
| + | </tr> | ||
| + | </table> | ||
| + | </br></br> | ||
| + | |||
| + | <p><a name="Simulation Results2" id="Simulation Results2"></a><span style="font-style: normal; font-weight: bold; color:#ddbf73;">Simulation Results</span></p> | ||
| + | |||
| + | <div class="kuang" style="width:470px"> | ||
| + | </br><a href="https://static.igem.org/mediawiki/2015/a/a4/%E5%B8%8C%E7%93%A6%E6%B0%8F%E5%9B%BE1.jpg" target="_blank" ><img src= "https://static.igem.org/mediawiki/2015/a/a4/%E5%B8%8C%E7%93%A6%E6%B0%8F%E5%9B%BE1.jpg" width="450" alt=""/></a> | ||
<div id="Enlarge"> | <div id="Enlarge"> | ||
| − | <p align="center"> <a href="https://static.igem.org/mediawiki/2015/ | + | <p> <b>Figure 2.</b> <span style="font-size: 14px"> The growth curve of <em>S.oneidensis</em> in MFC.</span> |
| + | <a href="https://static.igem.org/mediawiki/2015/a/a4/%E5%B8%8C%E7%93%A6%E6%B0%8F%E5%9B%BE1.jpg" width="20" height="20" align="right" alt="" /></a></p></div></div></br> | ||
| + | |||
| + | <div class="kuang" style="width:470px"> | ||
| + | </br><a href="https://static.igem.org/mediawiki/2015/e/e3/%E5%B8%8C%E7%93%A6%E6%B0%8F%E5%9B%BE2.jpg" target="_blank" ><img src= "https://static.igem.org/mediawiki/2015/e/e3/%E5%B8%8C%E7%93%A6%E6%B0%8F%E5%9B%BE2.jpg" width="450" alt=""/></a> | ||
| + | <div id="Enlarge"> | ||
| + | <p> <b>Figure 3.</b> <span style="font-size: 14px"> The conc. of lactate and acetate varies with time.</span> | ||
| + | <a href="https://static.igem.org/mediawiki/2015/e/e3/%E5%B8%8C%E7%93%A6%E6%B0%8F%E5%9B%BE2.jpg" width="20" height="20" align="right" alt="" /></a></p></div></div></br> | ||
| + | |||
| + | <div class="kuang" style="width:470px"> | ||
| + | </br><a href="https://static.igem.org/mediawiki/2015/5/58/%E5%B8%8C%E7%93%A6%E6%B0%8F%E5%9B%BE3.jpg" target="_blank" ><img src= "https://static.igem.org/mediawiki/2015/5/58/%E5%B8%8C%E7%93%A6%E6%B0%8F%E5%9B%BE3.jpg" width="450" alt=""/></a> | ||
| + | <div id="Enlarge"> | ||
| + | <p> <b>Figure 4.</b> <span style="font-size: 14px"> The conc. of Sq and Hq varies with time.</span> | ||
| + | <a href="https://static.igem.org/mediawiki/2015/5/58/%E5%B8%8C%E7%93%A6%E6%B0%8F%E5%9B%BE3.jpg" width="20" height="20" align="right" alt="" /></a></p></div></div></br> | ||
| + | |||
| + | <div class="kuang" style="width:470px"> | ||
| + | </br><a href="https://static.igem.org/mediawiki/2015/c/ca/%E5%B8%8C%E7%93%A6%E6%B0%8F%E5%9B%BE4.jpg" target="_blank" ><img src= "https://static.igem.org/mediawiki/2015/c/ca/%E5%B8%8C%E7%93%A6%E6%B0%8F%E5%9B%BE4.jpg" width="450" alt=""/></a> | ||
| + | <div id="Enlarge"> | ||
| + | <p> <b>Figure 5.</b> <span style="font-size: 14px"> The Current varies with time.</span> | ||
| + | <a href="https://static.igem.org/mediawiki/2015/c/ca/%E5%B8%8C%E7%93%A6%E6%B0%8F%E5%9B%BE4.jpg" width="20" height="20" align="right" alt="" /></a></p></div></div></br> | ||
| + | </br></br> | ||
| + | |||
| + | <p><a name="Parameters and variables2" id="Parameters and variables2"></a><span style="font-style: normal; font-weight: bold; color:#ddbf73;">Parameters and variables</span></p> | ||
| + | </br> | ||
| + | <table width="840" border="2" cellspacing="0"> | ||
| + | <tr> | ||
| + | <td align="center" width="168">Parameter</td> | ||
| + | <td align="center" width="336">Discribtion</td> | ||
| + | <td align="center" width="168">Number</td> | ||
| + | <td align="center" width="168">[Unit]</td> | ||
| + | </tr> | ||
| + | <tr> | ||
| + | <td align="center" width="168">v</td> | ||
| + | <td align="center" width="336">volume of reactor</td> | ||
| + | <td align="center" width="168">140E-3</td> | ||
| + | <td align="center" width="168">[L]</td> | ||
| + | </tr> | ||
| + | <tr> | ||
| + | <td align="center" width="168">μ<sub>max,L</sub></td> | ||
| + | <td align="center" width="336">the maximal specific growth rate taking lactate as substrate</td> | ||
| + | <td align="center" width="168">0.52</td> | ||
| + | <td align="center" width="168">[h<sup>-1</sup>]</td> | ||
| + | </tr> | ||
| + | <tr> | ||
| + | <td align="center" width="168">μ<sub>max,A</sub></td> | ||
| + | <td align="center" width="336">the maximal specific growth rate taking acetate as substrate</td> | ||
| + | <td align="center" width="168">0.28</td> | ||
| + | <td align="center" width="168">[h<sup>-1</sup>]</td> | ||
| + | </tr> | ||
| + | <tr> | ||
| + | <td align="center" width="168">k<sub>e</sub></td> | ||
| + | <td align="center" width="336">endogenous metabolism rate constant</td> | ||
| + | <td align="center" width="168">0.08</td> | ||
| + | <td align="center" width="168">[h<sup>-1</sup>]</td> | ||
| + | </tr> | ||
| + | <tr> | ||
| + | <td align="center" width="168">k<sub>c</sub></td> | ||
| + | <td align="center" width="336">acetate competitive inhibition constant</td> | ||
| + | <td align="center" width="168">1.3</td> | ||
| + | <td align="center" width="168">[dimensionless]</td> | ||
| + | </tr> | ||
| + | <tr> | ||
| + | <td align="center" width="168">k<sub>u</sub></td> | ||
| + | <td align="center" width="336">acetate uncompetitive inhibition constant</td> | ||
| + | <td align="center" width="168">8.3E-3</td> | ||
| + | <td align="center" width="168">[dimensionless]</td> | ||
| + | </tr> | ||
| + | <tr> | ||
| + | <td align="center" width="168">k<sub>R</sub></td> | ||
| + | <td align="center" width="336">acetate productive inhibition constant</td> | ||
| + | <td align="center" width="168">12.6E-3</td> | ||
| + | <td align="center" width="168">[mol∙L<sup>-1</sup>]</td> | ||
| + | </tr> | ||
| + | <tr> | ||
| + | <td align="center" width="168">k<sub>s,L</sub></td> | ||
| + | <td align="center" width="336">half-saturation constant of Monod equation taking lactate as substrate</td> | ||
| + | <td align="center" width="168">12E-3</td> | ||
| + | <td align="center" width="168">[mol∙L<sup>-1</sup>]</td> | ||
| + | </tr> | ||
| + | <tr> | ||
| + | <td align="center" width="168">k<sub>s,A</sub></td> | ||
| + | <td align="center" width="336">half-saturation constant of Monod equation taking aactate as substrate</td> | ||
| + | <td align="center" width="168">12.3E-3</td> | ||
| + | <td align="center" width="168">[mol∙L<sup>-1</sup>]</td> | ||
| + | </tr> | ||
| + | <tr> | ||
| + | <td align="center" width="168">k<sub>M<sub>ox</sub></sub></td> | ||
| + | <td align="center" width="336">half-constant of Monod equation taking oxidized mediator as substrate</td> | ||
| + | <td align="center" width="168">6E-6</td> | ||
| + | <td align="center" width="168">[mol∙L<sup>-1</sup>]</td> | ||
| + | </tr> | ||
| + | <tr> | ||
| + | <td align="center" width="168">Y<sub>X/L</sub></td> | ||
| + | <td align="center" width="336">apparent biomass coefficient of lactate</td> | ||
| + | <td align="center" width="168">19.1</td> | ||
| + | <td align="center" width="168">[g dry cell/ mol lactate]</td> | ||
| + | </tr> | ||
| + | <tr> | ||
| + | <td align="center" width="168">Y<sub>X/A</sub></td> | ||
| + | <td align="center" width="336">apparent biomass coefficient of acetate</td> | ||
| + | <td align="center" width="168">16.8</td> | ||
| + | <td align="center" width="168">[g dry cell/ mol acetate]</td> | ||
| + | </tr> | ||
| + | <tr> | ||
| + | <td align="center" width="168">n</td> | ||
| + | <td align="center" width="336">the numbers of electron transfer</td> | ||
| + | <td align="center" width="168">1</td> | ||
| + | <td align="center" width="168">[mol e<sup>-</sup>/mol reaction]</td> | ||
| + | </tr> | ||
| + | <tr> | ||
| + | <td align="center" width="168">k<sub>f</sub></td> | ||
| + | <td align="center" width="336">oxidation rate constant</td> | ||
| + | <td align="center" width="168">5.2504E-5</td> | ||
| + | <td align="center" width="168">[h<sup>-1</sup>]</td> | ||
| + | </tr> | ||
| + | <tr> | ||
| + | <td align="center" width="168">k<sub>b</sub></td> | ||
| + | <td align="center" width="336">reduction rate constant</td> | ||
| + | <td align="center" width="168">5.2574E-5</td> | ||
| + | <td align="center" width="168">[h<sup>-1</sup>]</td> | ||
| + | </tr> | ||
| + | <tr> | ||
| + | <td align="center" width="168">α</td> | ||
| + | <td align="center" width="336">oxidization transfer coefficient in anode</td> | ||
| + | <td align="center" width="168">0.5</td> | ||
| + | <td align="center" width="168">[dimensionless]</td> | ||
| + | </tr> | ||
| + | <tr> | ||
| + | <td align="center" width="168">F</td> | ||
| + | <td align="center" width="336">faraday's constant</td> | ||
| + | <td align="center" width="168">96485</td> | ||
| + | <td align="center" width="168">[C∙mol<sup>-1</sup>]</td> | ||
| + | </tr> | ||
| + | <tr> | ||
| + | <td align="center" width="168">R</td> | ||
| + | <td align="center" width="336">ideal gas constant</td> | ||
| + | <td align="center" width="168">8.314</td> | ||
| + | <td align="center" width="168">[J∙mol<sup>-1</sup>∙K<sup>-1</sup>]</td> | ||
| + | </tr> | ||
| + | <tr> | ||
| + | <td align="center" width="168">T</td> | ||
| + | <td align="center" width="336">thermodynamic temperature</td> | ||
| + | <td align="center" width="168">303.15</td> | ||
| + | <td align="center" width="168">[K]</td> | ||
| + | </tr> | ||
| + | <tr> | ||
| + | <td align="center" width="168">ΔE</td> | ||
| + | <td align="center" width="336">The potential between riboflavin and the heme center of OM c-Cyts</td> | ||
| + | <td align="center" width="168">0.395</td> | ||
| + | <td align="center" width="168">[v]</td> | ||
| + | </tr> | ||
| + | <tr> | ||
| + | <td align="center" width="168">k<sub>0</sub></td> | ||
| + | <td align="center" width="336">standard rate constant</td> | ||
| + | <td align="center" width="168">0.10</td> | ||
| + | <td align="center" width="168">[h<sup>-1</sup>]</td> | ||
| + | </tr> | ||
| + | <tr> | ||
| + | <td align="center" width="168">v<sub>m</sub><sup>f</sup></td> | ||
| + | <td align="center" width="336">the maximum reaction rate constant</td> | ||
| + | <td align="center" width="168">6E-5</td> | ||
| + | <td align="center" width="168">[h<sup>-1</sup>]</td> | ||
| + | </tr> | ||
| + | <tr> | ||
| + | <td align="center" width="168">k<sub>iA</sub></td> | ||
| + | <td align="center" width="336">the dissociation constant of NADH</td> | ||
| + | <td align="center" width="168">1E-2</td> | ||
| + | <td align="center" width="168">[dimensionless]</td> | ||
| + | </tr> | ||
| + | <tr> | ||
| + | <td align="center" width="168">k<sub>mA</sub></td> | ||
| + | <td align="center" width="336">Michaelis constant when NADH saturation</td> | ||
| + | <td align="center" width="168">1E-2</td> | ||
| + | <td align="center" width="168">[dimensionless]</td> | ||
| + | </tr> | ||
| + | <tr> | ||
| + | <td align="center" width="168">k<sub>mB</sub></td> | ||
| + | <td align="center" width="336">Michaelis constant when riboflavin saturation</td> | ||
| + | <td align="center" width="168">1E-2</td> | ||
| + | <td align="center" width="168">[dimensionless]</td> | ||
| + | </tr> | ||
| + | <tr> | ||
| + | <td align="center" width="168">k<sub>1</sub></td> | ||
| + | <td align="center" width="336">the inhibition constants of riboflavin</td> | ||
| + | <td align="center" width="168">5E-4</td> | ||
| + | <td align="center" width="168">[dimensionless]</td> | ||
| + | </tr> | ||
| + | <tr> | ||
| + | <td align="center" width="168">k<sub>2</sub></td> | ||
| + | <td align="center" width="336">the inhibition constants of NADH</td> | ||
| + | <td align="center" width="168">10</td> | ||
| + | <td align="center" width="168">[dimensionless]</td> | ||
| + | </tr> | ||
| + | </table> | ||
| + | |||
| + | <!--此处为 Models for monocultures of <em>Shewanella</em> in MFC 部分--> | ||
| + | </br></br></br> | ||
| + | <!--此处为 Model for co-culture MFC 部分--> | ||
| + | |||
| + | <a name="Model for co-culture MFC" id="Model for co-culture MFC"></a><h3>3 Model for co-culture MFC</h3> <hr></br> | ||
| + | |||
| + | <a name="Growth Model of E.coli" id="Growth Model of <em>E.coli"></a><p><span style="font-style: normal; font-weight: bold; color:#ddbf73;">Growth Model of <em>E.coli</em></span></p> | ||
| + | |||
| + | <p align="justify">In order to figure out the kinetics feature of growth, substrate consumption and accumulation of metabolite in lactate producing <em>E.coli</em>, we construct kinetics model of fermentation process based on carbon balance. First of all, the fermentation process of lactate in <em>E.coli</em> under anaerobic conditions has been simplified and we make several assumptions as following:</p> | ||
| + | <p align="justify">① Except for carbon sources which serves as restrictive substrates, the growth of <em>E.coli</em> will not be affected by other nutrition in the medium.</p> | ||
| + | <p align="justify">② <em>E.coli</em> will use carbon sources to maintain its survival, division and proliferation while the accumulation of metabolites is also counted in.</p> | ||
| + | <p align="justify">③ The growth model of <em>E.coli</em> is equilibrium increase rather than structural increase, which means the ascending rate of biomass in <em>E.coli</em> increases as the same as the rate for cell weight accumulation.</p> | ||
| + | <p align="justify">④ We take lactate as the only one metabolites for accumulation and lactate increase is positively related to its growth rate. Besides, overmuch lactate will inhibit the growth of <em>E.coli</em>.</p> | ||
| + | </br> | ||
| + | |||
| + | <p align="justify">We further construct the carbon equilibrium calculations for anaerobic lactate fermentation in batches. Therefore, we figure out the following differential equations:</p> | ||
| + | </br> | ||
| + | <table width="840" border="0" cellspacing="0"> | ||
| + | <tr> | ||
| + | <td align="left" width="126"> </td> | ||
| + | <td align="center" width="588"><img src="https://static.igem.org/mediawiki/2015/9/9d/TJU_Modeling21.JPG" width="200" alt=""/></td></td> | ||
| + | <td align="right" width="126">(18)</td> | ||
| + | </tr> | ||
| + | </table> | ||
| + | </br> | ||
| + | <table width="840"> | ||
| + | <tr> | ||
| + | <td align="left" width="126"> </td> | ||
| + | <td align="center" width="588"><img src="https://static.igem.org/mediawiki/2015/9/97/TJU_Modeling22.JPG" width="250" alt=""/></td> | ||
| + | <td align="right" width="126">(19)</td> | ||
| + | </tr> | ||
| + | </table> | ||
| + | </br> | ||
| + | <table width="840"> | ||
| + | <tr> | ||
| + | <td align="left" width="126"> </td> | ||
| + | <td align="center" width="588"><img src="https://static.igem.org/mediawiki/2015/3/3d/TJU_Modeling23.JPG" width="100" alt=""/></td> | ||
| + | <td align="right" width="126">(20)</td> | ||
| + | </tr> | ||
| + | </table> | ||
| + | </br> | ||
| + | <p align="justify">Owing to the assumption of equilibrium increase in <em>E.coli</em>, the relations between specific growth rate of biomass and concentration of restrictive substrates can reflect in the Monod equations that we modeled. However, considering that the accumulation of lactate may inhibit bacteria growth, we introduce an extra inhibition factor for general Monod equation. Due to the positive relations between lactate accumulation and cell growth, the production of metabolites also share the same relation with biomass increase. In this way, Q<sub>p</sub> can be represented by using the function of μ<sub>E</sub>.</p> | ||
| + | </br> | ||
| + | <table width="840"> | ||
| + | <tr> | ||
| + | <td align="left" width="126"> </td> | ||
| + | <td align="center" width="588"><img src="https://static.igem.org/mediawiki/2015/b/b4/TJU_Modeling24.JPG" width="200" alt=""/></td></td> | ||
| + | <td align="right" width="126">(21)</td> | ||
| + | </tr> | ||
| + | </table> | ||
| + | </br> | ||
| + | <table width="840"> | ||
| + | <tr> | ||
| + | <td align="left" width="126"> </td> | ||
| + | <td align="center" width="588"><img src="https://static.igem.org/mediawiki/2015/8/84/TJU_Modeling25.JPG" width="210" alt=""/></td></td> | ||
| + | <td align="right" width="126">(22)</td> | ||
| + | </tr> | ||
| + | </table> | ||
| + | </br> | ||
| + | <table width="840"> | ||
| + | <tr> | ||
| + | <td align="left" width="126"> </td> | ||
| + | <td align="center" width="588"><img src="https://static.igem.org/mediawiki/2015/5/5e/TJU_Modeling26.JPG" width="100" alt=""/></td></td> | ||
| + | <td align="right" width="126">(23)</td> | ||
| + | </tr> | ||
| + | </table> | ||
| + | </br></br> | ||
| + | |||
| + | <a name="Simulation Results3" id="Simulation Results3"></a><p><span style="font-style: normal; font-weight: bold; color:#ddbf73;">Simulation Results</span></p> | ||
| + | |||
| + | <div class="kuang" style="width:470px"> | ||
| + | </br><a href="https://static.igem.org/mediawiki/2015/9/9f/%E5%A4%A7%E8%82%A0%E5%9B%BE1.jpg" target="_blank" ><img src= "https://static.igem.org/mediawiki/2015/9/9f/%E5%A4%A7%E8%82%A0%E5%9B%BE1.jpg" width="450" alt=""/></a> | ||
| + | <div id="Enlarge"> | ||
| + | <p> <b>Figure 6.</b> <span style="font-size: 14px"> The growth curve of <em><em>E.coli</em></em>.</span> | ||
| + | <a href="https://static.igem.org/mediawiki/2015/9/9f/%E5%A4%A7%E8%82%A0%E5%9B%BE1.jpg" width="20" height="20" align="right" alt="" /></a></p></div></div></br> | ||
| + | |||
| + | <div class="kuang" style="width:470px"> | ||
| + | </br><a href="https://static.igem.org/mediawiki/2015/6/6d/%E5%A4%A7%E8%82%A0%E5%9B%BE2.jpg" target="_blank" ><img src= "https://static.igem.org/mediawiki/2015/6/6d/%E5%A4%A7%E8%82%A0%E5%9B%BE2.jpg" width="450" alt=""/></a> | ||
| + | <div id="Enlarge"> | ||
| + | <p> <b>Figure 7.</b> <span style="font-size: 14px"> The conc. of lactate and acetate varies with time.</span> | ||
| + | <a href="https://static.igem.org/mediawiki/2015/6/6d/%E5%A4%A7%E8%82%A0%E5%9B%BE2.jpg" width="20" height="20" align="right" alt="" /></a></p></div></div></br> | ||
| + | </br></br> | ||
| + | |||
| + | <p><a name="Parameters and variables3" id="Parameters and variables3"></a><span style="font-style: normal; font-weight: bold; color:#ddbf73;">Parameters and variables</span></p> | ||
| + | </br> | ||
| + | <table width="840" border="2" cellspacing="0"> | ||
| + | <tr> | ||
| + | <td align="center" width="168">Parameter</td> | ||
| + | <td align="center" width="336">Discribtion</td> | ||
| + | <td align="center" width="168">Number</td> | ||
| + | <td align="center" width="168">[Unit]</td> | ||
| + | </tr> | ||
| + | |||
| + | <tr> | ||
| + | <td align="center" width="168">k</td> | ||
| + | <td align="center" width="336">lactate inhibition constant</td> | ||
| + | <td align="center" width="168">0.085</td> | ||
| + | <td align="center" width="168">[L/mol]</td> | ||
| + | </tr> | ||
| + | |||
| + | <tr> | ||
| + | <td align="center" width="168">k<sub>S,G</sub></td> | ||
| + | <td align="center" width="336">Half-saturation constant taking glucose as substrate</td> | ||
| + | <td align="center" width="168">14E-3</td> | ||
| + | <td align="center" width="168">[L/mol]</td> | ||
| + | </tr> | ||
| + | |||
| + | <tr> | ||
| + | <td align="center" width="168">k<sub>S,L</sub></td> | ||
| + | <td align="center" width="336">Half-saturation constant taking lactate as substrate</td> | ||
| + | <td align="center" width="168">20E-3</td> | ||
| + | <td align="center" width="168">[L/mol]</td> | ||
| + | </tr> | ||
| + | |||
| + | <tr> | ||
| + | <td align="center" width="168">μ<sub>EG,max</sub></td> | ||
| + | <td align="center" width="336">E.coli's maximal specific growth rate taking glucose as substrate</td> | ||
| + | <td align="center" width="168">1.3</td> | ||
| + | <td align="center" width="168">[h<sup>-1<sup>]</td> | ||
| + | </tr> | ||
| + | |||
| + | <tr> | ||
| + | <td align="center" width="168">μ<sub>E/L,max</sub></td> | ||
| + | <td align="center" width="336">E.coli's maximal specific growth rate taking lactate as substrate</td> | ||
| + | <td align="center" width="168">0.4</td> | ||
| + | <td align="center" width="168">[h<sup>-1<sup>]</td> | ||
| + | </tr> | ||
| + | |||
| + | <tr> | ||
| + | <td align="center" width="168">k<sub>L,C</sub></td> | ||
| + | <td align="center" width="336">lactate competitive inhibition constant</td> | ||
| + | <td align="center" width="168">1</td> | ||
| + | <td align="center" width="168">[dimensionless]</td> | ||
| + | </tr> | ||
| + | |||
| + | <tr> | ||
| + | <td align="center" width="168">k<sub>L,U</sub></td> | ||
| + | <td align="center" width="336">lactate uncompetitive inhibition constant</td> | ||
| + | <td align="center" width="168">200E-3</td> | ||
| + | <td align="center" width="168">[dimensionless]</td> | ||
| + | </tr> | ||
| + | |||
| + | <tr> | ||
| + | <td align="center" width="168">m<sub>E</sub></td> | ||
| + | <td align="center" width="336">Endogenous metabolism rate constant of <em>E.coli</em></td> | ||
| + | <td align="center" width="168">0.006</td> | ||
| + | <td align="center" width="168">[h<sup>-1<sup>]</td> | ||
| + | </tr> | ||
| + | |||
| + | <tr> | ||
| + | <td align="center" width="168">k<sub>L,R</sub></td> | ||
| + | <td align="center" width="336">Lactate productive inhibition constant</td> | ||
| + | <td align="center" width="168">12.6E-3</td> | ||
| + | <td align="center" width="168">[mol∙L<sup>-1</sup>]</td> | ||
| + | </tr> | ||
| + | |||
| + | <tr> | ||
| + | <td align="center" width="168">v</td> | ||
| + | <td align="center" width="336">volume of reactor</td> | ||
| + | <td align="center" width="168">140E-3</td> | ||
| + | <td align="center" width="168">[L]</td> | ||
| + | </tr> | ||
| + | |||
| + | <tr> | ||
| + | <td align="center" width="168">Y<sub>XE/G</sub></td> | ||
| + | <td align="center" width="336">apparent biomass coefficient of lactate</td> | ||
| + | <td align="center" width="168">8.1</td> | ||
| + | <td align="center" width="168">[g dry cell/ mol lactate]</td> | ||
| + | </tr> | ||
| + | |||
| + | <tr> | ||
| + | <td align="center" width="168">Y<sub>XE/L</sub></td> | ||
| + | <td align="center" width="336">apparent biomass coefficient of lactate</td> | ||
| + | <td align="center" width="168">5.8</td> | ||
| + | <td align="center" width="168">[g dry cell/ mol lactate]</td> | ||
| + | </tr> | ||
| + | |||
| + | <tr> | ||
| + | <td align="center" width="168">Y<sub>L/G</sub></td> | ||
| + | <td align="center" width="336">apparent biomass coefficient of lactate</td> | ||
| + | <td align="center" width="168">1.5</td> | ||
| + | <td align="center" width="168">[g dry cell/ mol lactate]</td> | ||
| + | </tr> | ||
| + | </table> | ||
| + | </br></br></br> | ||
| + | |||
| + | <a name="Model for P170 promoter" id="Model for P170 promoter"></a><h3>4 Model for P170 promoter</h3> <hr></br> | ||
| + | |||
| + | <a name="Introduction" id="Introduction"></a><p><span style="font-style: normal; font-weight: bold; color:#ddbf73;">Introduction</span></p> | ||
| + | <p align="justify">P170 is an acid-induced promoter. When rcfB protein is activated by lactic acid, it can bind to P170 and make it sensitive to RNA polymerase. In order to detect and control the concentration of lactic acid, we use P170 and RFP gene, which shows the relationship between lactic acid and fluorescence.</p></br> | ||
| + | <div class="kuang" style="width:470px"> | ||
| + | </br><a href="https://static.igem.org/mediawiki/2015/9/99/%E8%B0%83%E6%8E%A7%E6%A8%A1%E5%9D%972.png" target="_blank" ><img src= "https://static.igem.org/mediawiki/2015/9/99/%E8%B0%83%E6%8E%A7%E6%A8%A1%E5%9D%972.png" width="450" alt=""/></a> | ||
| + | <div id="Enlarge"> | ||
| + | <p> <b>Figure 7.</b> <span style="font-size: 14px">Reaction network of genetic regulation circuit</span> | ||
| + | <a href="https://static.igem.org/mediawiki/2015/9/99/%E8%B0%83%E6%8E%A7%E6%A8%A1%E5%9D%972.png" width="20" height="20" align="right" alt="" /></a></p></div></div></br> | ||
| + | <p align="left">From the reaction network We can extract follow equation sets From the reaction network:</p></br> | ||
| + | |||
| + | <table width="840"> | ||
| + | <tr> | ||
| + | <td align="left" width="126"> </td> | ||
| + | <td align="center" width="588"><img src="https://static.igem.org/mediawiki/2015/b/bb/TJU_Modeling27.JPG" width="300" alt=""/></td> | ||
| + | <td align="right" width="126"> </td> | ||
| + | </tr> | ||
| + | </table> | ||
| + | <table width="840"> | ||
| + | <tr> | ||
| + | <td align="left" width="126"> </td> | ||
| + | <td align="center" width="588"><img src="https://static.igem.org/mediawiki/2015/7/70/TJU_Modeling28.JPG" width="300" alt=""/></td> | ||
| + | <td align="right" width="126"> </td> | ||
| + | </tr> | ||
| + | </table> | ||
| + | </br></br> | ||
| + | |||
| + | <a name="Assumptions4" id="Assumptions4"></a><p><span style="font-style: normal; font-weight: bold; color:#ddbf73;">Assumptions</span></p> | ||
| + | <p align="left"> 1. Use steady-state approximation on mRNA and mRNA-rib.</p> | ||
| + | <p align="justify"> 2. Assume that all enzymes activity are not affected by acid concentration, the rate constant remain unchanged.</p> | ||
| + | <p align="left"> 3. Suppose that the concentration of rcfB protein is constant, its magnitude is determined by the strength of the upstream areas of promoter.</p></br></br></br> | ||
| + | |||
| + | <a name="Equation Establishment4" id="Equation Establishment4"></a><p><span style="font-style: normal; font-weight: bold; color:#ddbf73;">Equation Establishment</span></p> | ||
| + | <p align="justify">Genetic regulation circuit is shown in Figure 1.When rcfB protein is activated by lactic acid, it can bind to P170 and make it sensitive to RNA polymerase.</p></br> | ||
| + | |||
| + | <table width="840"> | ||
| + | <tr> | ||
| + | <td align="left" width="126"> </td> | ||
| + | <td align="center" width="588"><img src="https://static.igem.org/mediawiki/2015/4/44/TJU_Modeling29.JPG" width="300" alt=""/></td> | ||
| + | <td align="right" width="126">(24)</td> | ||
| + | </tr> | ||
| + | </table> | ||
| + | </br> | ||
| + | <table width="840"> | ||
| + | <tr> | ||
| + | <td width="126"> </td> | ||
| + | <td align="center" width="588"><img src=" https://static.igem.org/mediawiki/2015/6/69/TJU_Modeling30.JPG" width="300" alt=""/></td> | ||
| + | <td align="right" width="126">(25)</td> | ||
| + | </tr> | ||
| + | </table> | ||
| + | </br> | ||
| + | <p align="justify">where K<sub>La</sub> and K are constants and n is Hill coefficient The acP170 is the activated state, the P170 can be activated in two ways. One is to bind with the lactic acid dimerization and RcfB which can make it easy to be activated. Another one, we assume that a of P170 can be activated directly. Both the binding and unbinding P170 can be promoted while they have different rate constant. | ||
| + | </p> | ||
| + | <p align="left">We conclude that:</p> | ||
| + | </br> | ||
| + | <table width="840"> | ||
| + | <tr> | ||
| + | <td align="left" width="126"> </td> | ||
| + | <td align="center" width="588"><img src="https://static.igem.org/mediawiki/2015/7/7d/TJU_Modeling31.JPG" width="300" alt=""/></td> | ||
| + | <td align="right" width="126">(26)</td> | ||
| + | </tr> | ||
| + | </table> | ||
| + | </br> | ||
| + | <table width="840"> | ||
| + | <tr> | ||
| + | <td align="left" width="126"> </td> | ||
| + | <td align="center" width="588"><img src="https://static.igem.org/mediawiki/2015/5/59/TJU_Modeling32.JPG" width="400" alt=""/></td> | ||
| + | <td align="right" width="126">(27)</td> | ||
| + | </tr> | ||
| + | </table> | ||
| + | </br> | ||
| + | |||
| + | <p align="left">According to the equation above, we can consolidate that:</p> | ||
| + | </br> | ||
| + | <table width="840"> | ||
| + | <tr> | ||
| + | <td align="left" width="126"> </td> | ||
| + | <td align="center" width="588"><img src="https://static.igem.org/mediawiki/2015/1/12/TJU_Modeling33.JPG" width="200" alt=""/></td> | ||
| + | <td align="right" width="126">(28)</td> | ||
| + | </tr> | ||
| + | </table> | ||
| + | </br> | ||
| + | <p align="left">Where km1 and km2 are integration parameters.</p></br> | ||
| + | |||
| + | <p align="left">Next, by using law of mass action and steady state solution, we deduce the equation below. </p> | ||
| + | </br> | ||
| + | <table width="840"> | ||
| + | <tr> | ||
| + | <td align="left" width="126"> </td> | ||
| + | <td align="center" width="588"><img src="https://static.igem.org/mediawiki/2015/7/71/TJU_Modeling34.JPG" width="588" alt=""/></td> | ||
| + | <td align="right" width="126">(29)</td> | ||
| + | </tr> | ||
| + | </table> | ||
| + | </br> | ||
| + | <table width="840"> | ||
| + | <tr> | ||
| + | <td align="left" width="126"> </td> | ||
| + | <td align="center" width="588"><img src="https://static.igem.org/mediawiki/2015/e/ea/TJU_Modeling35.JPG" width="500" alt=""/></td> | ||
| + | <td align="right" width="126">(30)</td> | ||
| + | </tr> | ||
| + | </table> | ||
| + | </br> | ||
| + | <p align="left">Where the concentration of mRNA and mRNA-rib satisfies:</p> | ||
| + | </br> | ||
| + | <table width="840"> | ||
| + | <tr> | ||
| + | <td align="left" width="126"> </td> | ||
| + | <td align="center" width="588"><img src="https://static.igem.org/mediawiki/2015/f/f7/TJU_Modeling36.JPG" width="450" alt=""/></td> | ||
| + | <td align="right" width="126">(31)</td> | ||
| + | </tr> | ||
| + | </table> | ||
| + | </br> | ||
| + | <table width="840"> | ||
| + | <tr> | ||
| + | <td align="left" width="126"> </td> | ||
| + | <td align="center" width="588"><img src="https://static.igem.org/mediawiki/2015/1/12/TJU_Modeling37.JPG" width="250" alt=""/></td> | ||
| + | <td align="right" width="126">(32)</td> | ||
| + | </tr> | ||
| + | </table> | ||
| + | </br> | ||
| + | <p align="left">In the end, the concentration of RFP and the fluorescence can be written as:</p> | ||
| + | </br> | ||
| + | <table width="840"> | ||
| + | <tr> | ||
| + | <td align="left" width="126"> </td> | ||
| + | <td align="center" width="588"><img src="https://static.igem.org/mediawiki/2015/0/08/TJU_Modeling39.JPG" width="250" alt=""/></td> | ||
| + | <td align="right" width="126">(33)</td> | ||
| + | </tr> | ||
| + | </table> | ||
| + | </br> | ||
| + | <table width="840"> | ||
| + | <tr> | ||
| + | <td align="left" width="126"> </td> | ||
| + | <td align="center" width="588"><img src="https://static.igem.org/mediawiki/2015/a/ac/TJU_Modeling40.JPG" width="300" alt=""/></td> | ||
| + | <td align="right" width="126">(34)</td> | ||
| + | </tr> | ||
| + | </table> | ||
| + | </br> | ||
| + | <p align="justify">Thus we construct the connection between fluorescence and lactic acid, from which we can know the concentration of lactic acid through the system.</p> | ||
| + | </br></br> | ||
| + | |||
| + | <a name="Simulation Results4" id="Simulation Results4"></a><p><span style="font-style: normal; font-weight: bold; color:#ddbf73;">Simulation Results</span></p> | ||
| + | <p align="left">We set k<sub>m1</sub> =10 and use promoter J23100, then we get the following result </p> | ||
| + | </br> | ||
| + | <div class="kuang" style="width:470px"> | ||
| + | </br><a href="https://static.igem.org/mediawiki/2015/d/d4/%E8%B0%83%E6%8E%A71.png" target="_blank" ><img src= "https://static.igem.org/mediawiki/2015/d/d4/%E8%B0%83%E6%8E%A71.png" width="450" alt=""/></a> | ||
| + | <div id="Enlarge"> | ||
| + | <p> <b>Figure 8.</b> <span style="font-size: 14px">The result shows how P170,mRNA,mRNA-rib,fluorescence change with the lactic acid.</span> | ||
| + | <a href="https://static.igem.org/mediawiki/2015/d/d4/%E8%B0%83%E6%8E%A71.png" width="20" height="20" align="right" alt="" /></a></p></div></div></br> | ||
| + | </br></br> | ||
| + | |||
| + | |||
| + | <a name="Fine tuning" id="Fine tuning"></a><p><span style="font-style: normal; font-weight: bold; color:#ddbf73;">Fine tuning</span></p> | ||
| + | <p align="left">From the equation, we can predict that:</p> | ||
| + | <p align="left">1. the integration parameter k<sub>m1</sub> can characterize the relative level of leakage.</p> | ||
| + | <p align="left">2. the larger the RcfB concentration is, the quicker the fluorescence will be.</p> | ||
| + | </br> | ||
| + | |||
| + | <p align="justify">At first we have the constitutive promoter fine-tuning. The BIT-China suggests us using different promoters in our construction. The performance of promoter P170 and rCfB play an important role. We choose to use different constitutive promoter J23103 J23109 J23107 and J23100 for the result (Figure 9). According to the figures, we can get the highest rate of change in fluorescence when we use J23100 promoter which is also the most sensitive one among all the promoter testing. Therefore, we choose J23100 promoter since it is convenient to represent lactate concentration by using fluorescence as the measurement. Particularly, when we have a stronger promoter, the amount of rcfB will be more during stable state. As a result gained from equation, the P170 can be activated in a faster speed and consequently, the changing rate of fluorescence will be greater as well.</p> | ||
| + | </br> | ||
| + | <div class="kuang" style="width:470px"> | ||
| + | </br><a href="https://static.igem.org/mediawiki/2015/6/67/%E8%B0%83%E6%8E%A72.png" target="_blank" ><img src= "https://static.igem.org/mediawiki/2015/6/67/%E8%B0%83%E6%8E%A72.png" width="450" alt=""/></a> | ||
| + | <div id="Enlarge"> | ||
| + | <p> <b>Figure 9.</b> <span style="font-size: 14px">Fluorescence changes with time when rcfB is constitutively activated by J23100, J23103, J23107 and J23109,respectively.</span> | ||
| + | <a href="https://static.igem.org/mediawiki/2015/6/67/%E8%B0%83%E6%8E%A72.png" width="20" height="20" align="right" alt="" /></a></p></div></div></br> | ||
| + | </br> | ||
| + | <p align="justify">Next, we will explore the effect brought by leakage which means that P170 can activate and lead to fluorescence expression when lactate doesn’t exist. We have predicted that k<sub>m1</sub> is the index of leakage. k<sub>m1</sub> is higher, then we get more leakage shown up. Here we make k_m1 equals to 1, 10, 50 respectively and the result is shown in Figure 9. As predicted, the result is well suited to our calculation, because k<sub>m1</sub> is a constant unrelated to lactate concentration. It has a remarkable influence on the result when lactate amount is relatively small.</br> | ||
| + | Then we will analyze the constants related to k<sub>m1</sub>, which mainly contains rate k<sub>3</sub> that is directly activated by P170 as well as proportion , which can both affect leakage. Our target is reducing the leakage expression, thus, we need to lower those constants as much as possible.</p> | ||
| + | </br> | ||
| + | <div class="kuang" style="width:470px"> | ||
| + | </br><a href="https://static.igem.org/mediawiki/2015/9/93/%E8%B0%83%E6%8E%A73.png" target="_blank" ><img src= "https://static.igem.org/mediawiki/2015/9/93/%E8%B0%83%E6%8E%A73.png" width="450" alt=""/></a> | ||
| + | <div id="Enlarge"> | ||
| + | <p> <b>Figure 9.</b> <span style="font-size: 14px">Fluorescence changes with time when k_m1 equals to 1, 10, 50. Difference has been show to illustrate the situation of different k<sub>m1</sub> under limited lactate concentration.</span> | ||
| + | <a href="https://static.igem.org/mediawiki/2015/9/93/%E8%B0%83%E6%8E%A73.png" width="20" height="20" align="right" alt="" /></a></p></div></div></br> | ||
| + | </br> | ||
| + | </br> | ||
| + | |||
| + | |||
| + | <p><a name="Parameters and variables4" id="Parameters and variables4"></a><span style="font-style: normal; font-weight: bold; color:#ddbf73;">Parameters and variables</span></p> | ||
| + | </br> | ||
| + | <table width="840"> | ||
| + | <tr> | ||
| + | <td align="center"><img src="https://static.igem.org/mediawiki/2015/0/06/%E5%8F%82%E6%95%B01.PNG" width="800" alt=""/></td> | ||
| + | </tr> | ||
| + | </table> | ||
| + | </br> | ||
| + | <table width="840"> | ||
| + | <tr> | ||
| + | <td align="center"><img src="https://static.igem.org/mediawiki/2015/0/07/%E5%8F%82%E6%95%B02.PNG" width="800" alt=""/></td> | ||
| + | </tr> | ||
| + | </table> | ||
| + | </br> | ||
| + | |||
| + | |||
| + | |||
| + | </div><!--END OF body-PART-r--> | ||
| + | <div id="foot"><p>E-mail: ggjyliuyue@gmail.com |Address: Building No.20, No.92 Weijin road, Tianjin University, China | Zip-cod: 300072</br> | ||
| + | </p> | ||
| + | <p>Copyright 2015@TJU iGEM Team</p></div> | ||
| + | </div> | ||
| + | </html> | ||
| + | </div><!--END OF contain--> | ||
Revision as of 01:36, 18 September 2015


1 Gene Expression Model for Lactate production
Simplification and Assumption
① Simplifications and assumptions for metabolic pathway and gene insertion:supposing that we have adequate glucose and constant pyruvate, the latter used to product lactate can be replenished by glucose in E.coli. Naturally, E.coli can itself produce lactate dehydrogenase (ldh) through ldhA gene expression. Later, we attempt to introduce plasmids with ldh gene, which can produce the extra ldh as an approach to generate even more lactate. However, the excessive ldh, to a certain degree, will also inhibit ldh gene expression.
② Simplifications and assumptions for Michaelis-Menten equation: we want to figure out the relations between the speed of lactate production and the amount of ldh expression. But, there is a precondition in Michaelis-Menten equation, namely, the total amount of enzyme in solution keeps unchanged.
So, we need to modify the existing Michaelis-Menten equation:
 |
The above equation reflects a general enzyme catalytic reaction process. With the help of steady state approximation, the equation can transform from first-order reaction to zero-order reaction. Because of the constant substrate concentration as we assumed, the variable in the equation is the variation of ldh amount, which means that the independent variable in the Michaelis-Menten equation turns into the enzyme amount. (variable change from [S] into [E])
 |
in which : |
 |
 |
(1) |
③ Simplification of transmembrane transfer: the original pH in the medium is slightly greater than 7 and the pH can keep constant with the buffer function of KHPO4 together with KH2PO4. Suppose that Shewanella can absorb lactate brought by E.coli timely, thus, pH can remain stable, which is around 7.2 based on our hypothesis. Further, we assume that transmembrane transfer belongs to codiffusion where the concentration difference of H+ and acid groups can drive the whole process. Therefore, the transmembrane transfer is only related to the intra membrane concentration of H+ and acid groups.
Equation Establishment
Firstly, we establish the equation of ldh amount changing with time. The following equations represent the ldh production rate in E.coli without the plasmid insertion and with the plasmid introduction, respectively.
 |
(2) |
|
 |
(3) |
Next, we construct the lactate production rate equation:
 |
(4) |
Finally, the lactate transmembrane transfer equations has been figured out. It shows that lactate will be transferred to the outside at the time it produced. We represent the intra membrane with c and extra membrane with e.
 |
The transmembrane transfer rate:
 |
(5) |
When lactate production is combined with its transfer, we can get the following equation:
 |
(6) |
Simulation Results

2 Models for monocultures of Shewanella in MFC
Shewanella Growth Model Based on Carbon Balance
At the very beginning, we construct a fermentation kinetic model based on the Monod Equation to draw a picture of carbon balance between biomass increase and base consumption during S.oneidensis MR-1 growth. Before generation our modeling, we simplify the center process of carbon metabolism in Shewanella via making assumptions as follows:
① Lactate is the preferable carbon source for Shewanella. Lactate can transform into pyruvate by dehydrogenation, which then converts mostly into acetyl coenzyme. Subsequently, acetyl coenzyme can either be oxidized into CO2 and release energy by TCA Circle or transform into acetate.
② When there are too much lactate, the producing rate of acetyl coenzyme will be greater than the consuming rate of that in TCA circle. The excessive acetyl coenzyme will convert into acetate and release to the outside. Inversely, the shortage of lactate leads the utilization of acetate which then maintains the metabolism by acetyl coenzyme formation.
③ Although both acetate and lactate can be used as carbon sources for Shewanella, acetate can restrain its growth. On the one hand, acetate will drop the acidity inside the cell, which, a step forward, can affect the activity of enzyme in vivo resulted in uncompetitive inhibition to cell growth. On the other hand, acetate can itself limit the growth by uncompetitive inhibition. In particular, the process of acetate metabolism and lactate metabolism are competing for acetyl coenzyme, which reduces the lactate utilization and influences cell growth. (Tang & Meadows, 2006)
④ The redox of mediator in the outer membrane is the rate-limiting step of electron transfer chain in Shewanella. TCA circle, an important pathway for the synthesis of energy and biomass , largely depends on the concentration of electron receptor at the end of electron transfer chain. When there is a deficiency of oxidized mediator, TCA circle will be inhibited, thereby, affect the whole process of metabolism as well as biomass increase.
According to the four assumptions above along with acetate uncompetitive inhibition and competitive inhibition, we decide to use multi-substrates Monod equation(Blanch & Clark, 1997) with two kinds of inhibition to demonstrate the relations between restrictive substrates and biomass increase rate. Considering that the accumulation of NADH will remarkably affect metabolic process under anaerobic conditions, we add a product factor in the Monod equation reflecting metabolites inhibition function. μ
 |
(7) |
|
 |
(8) |
Biomass, lactate and acetate concentration can vary with time and its construction depends on kinetic model which is based on the general kinetics of the fermentation process model. Consumption of lactate and acetate can be both used for biomass increase and endogenous metabolism maintenance. However, considering the rarely energy losses caused by metabolism in vivo, we ignore the carbon consumption brought by metabolism. In this way, lactate can only be used for biomass increase and acetate production while acetate is merely used for biomass increase.
 |
(9) |
|
 |
(10) |
|
 |
(11) |
Extracellular Electron Transfer Model
Extracellular Electron Transfer (EET) process can deliver the electrons between electrode and cell membrane with mediating functions of redox active molecules including FMN and riboflavin. It can be subdivided into the oxidation of reduced mediator and reduction of oxidized mediator in electrode.
We establish a model kinetics of electrode process on the basis of Bulter-Volmer equation to illustrate the oxidation of reduced mediator in electrode. Firstly, we make several assumptions just like the following tips:
①Although both of FMN and riboflavin can serve as mediator in electrode redox, we only take riboflavin into consideration for simplification in the model.
② There are two kinds of EET pathway model for riboflavin mediating. One of these called single-electron transfer in which riboflavin acts as cofactor of MtrC protein and can be reduced into semiquinone (Sq) with the standard electrode potential of -260v. Another one is two-electron transfer where the dissociative riboflavin binds to outer membrane c-Cyts as a cofactor in the hydroquinone (Hq) form with shifted potential of -145v. Under conditions of the same electrode and concentration, the exchange current density of single-electron transfer is much high than that of two-electron transfer since enzymatic reaction can greatly decrease its activation energy. Therefore, we assumed that current generation reaction in anode mainly belongs to the single-electron transfer.
③Oxidation of Sq in electrode is the reversible first order reaction. The net rate for this kind of reaction is made up by the difference between oxidized rate of Sq and reduced rate of riboflavin in electrode.
Accordingly, current density in anode can be calculated by Bulter-Vlomer equation:
 |
(12) |
Redox reaction rate constant can be calculated by Arrhenius equation:
 |
(13) |
|
 |
(14) |
As for the reduction of oxidized mediator in outer membrane for Shewanella, we establish a kinetics of enzyme catalyzed reaction on the basis of Michaelis-Menten equation, accordingly.
①Similarly, we also consider the single-electron transfer as the only pathway in vivo.
② In such single-electron transfer process, riboflavin reduction kinetics characteristics follows the general rules of enzymatic reaction.
③The reduction of riboflavin is related to the reducing state of OM c-Cyts heme center which is also the terminal of EET pathway. Due to the electrons brought by NADH or NADPH from respiration, we argue that the process of riboflavin reduction into Sq is coupled with NADH from respiration process.
Based on the assumptions above, we believe the respiration of OM riboflavin has something to do with its concentration and NADH production rate. According to the kinetics of enzyme catalyzed reaction, we use multi-substrates Michaelis-Menten equation to determine the whole process:
 |
(15) |
|
 |
(16) |
|
 |
(17) |


| Parameter | Discribtion | Number | [Unit] |
| v | volume of reactor | 140E-3 | [L] |
| μmax,L | the maximal specific growth rate taking lactate as substrate | 0.52 | [h-1] |
| μmax,A | the maximal specific growth rate taking acetate as substrate | 0.28 | [h-1] |
| ke | endogenous metabolism rate constant | 0.08 | [h-1] |
| kc | acetate competitive inhibition constant | 1.3 | [dimensionless] |
| ku | acetate uncompetitive inhibition constant | 8.3E-3 | [dimensionless] |
| kR | acetate productive inhibition constant | 12.6E-3 | [mol∙L-1] |
| ks,L | half-saturation constant of Monod equation taking lactate as substrate | 12E-3 | [mol∙L-1] |
| ks,A | half-saturation constant of Monod equation taking aactate as substrate | 12.3E-3 | [mol∙L-1] |
| kMox | half-constant of Monod equation taking oxidized mediator as substrate | 6E-6 | [mol∙L-1] |
| YX/L | apparent biomass coefficient of lactate | 19.1 | [g dry cell/ mol lactate] |
| YX/A | apparent biomass coefficient of acetate | 16.8 | [g dry cell/ mol acetate] |
| n | the numbers of electron transfer | 1 | [mol e-/mol reaction] |
| kf | oxidation rate constant | 5.2504E-5 | [h-1] |
| kb | reduction rate constant | 5.2574E-5 | [h-1] |
| α | oxidization transfer coefficient in anode | 0.5 | [dimensionless] |
| F | faraday's constant | 96485 | [C∙mol-1] |
| R | ideal gas constant | 8.314 | [J∙mol-1∙K-1] |
| T | thermodynamic temperature | 303.15 | [K] |
| ΔE | The potential between riboflavin and the heme center of OM c-Cyts | 0.395 | [v] |
| k0 | standard rate constant | 0.10 | [h-1] |
| vmf | the maximum reaction rate constant | 6E-5 | [h-1] |
| kiA | the dissociation constant of NADH | 1E-2 | [dimensionless] |
| kmA | Michaelis constant when NADH saturation | 1E-2 | [dimensionless] |
| kmB | Michaelis constant when riboflavin saturation | 1E-2 | [dimensionless] |
| k1 | the inhibition constants of riboflavin | 5E-4 | [dimensionless] |
| k2 | the inhibition constants of NADH | 10 | [dimensionless] |
3 Model for co-culture MFC
Growth Model of E.coli
In order to figure out the kinetics feature of growth, substrate consumption and accumulation of metabolite in lactate producing E.coli, we construct kinetics model of fermentation process based on carbon balance. First of all, the fermentation process of lactate in E.coli under anaerobic conditions has been simplified and we make several assumptions as following:
① Except for carbon sources which serves as restrictive substrates, the growth of E.coli will not be affected by other nutrition in the medium.
② E.coli will use carbon sources to maintain its survival, division and proliferation while the accumulation of metabolites is also counted in.
③ The growth model of E.coli is equilibrium increase rather than structural increase, which means the ascending rate of biomass in E.coli increases as the same as the rate for cell weight accumulation.
④ We take lactate as the only one metabolites for accumulation and lactate increase is positively related to its growth rate. Besides, overmuch lactate will inhibit the growth of E.coli.
We further construct the carbon equilibrium calculations for anaerobic lactate fermentation in batches. Therefore, we figure out the following differential equations:
 |
(18) |
 |
(19) |
 |
(20) |
Owing to the assumption of equilibrium increase in E.coli, the relations between specific growth rate of biomass and concentration of restrictive substrates can reflect in the Monod equations that we modeled. However, considering that the accumulation of lactate may inhibit bacteria growth, we introduce an extra inhibition factor for general Monod equation. Due to the positive relations between lactate accumulation and cell growth, the production of metabolites also share the same relation with biomass increase. In this way, Qp can be represented by using the function of μE.
 |
(21) |
 |
(22) |
 |
(23) |
Simulation Results


| Parameter | Discribtion | Number | [Unit] |
| k | lactate inhibition constant | 0.085 | [L/mol] |
| kS,G | Half-saturation constant taking glucose as substrate | 14E-3 | [L/mol] |
| kS,L | Half-saturation constant taking lactate as substrate | 20E-3 | [L/mol] |
| μEG,max | E.coli's maximal specific growth rate taking glucose as substrate | 1.3 | [h-1] |
| μE/L,max | E.coli's maximal specific growth rate taking lactate as substrate | 0.4 | [h-1] |
| kL,C | lactate competitive inhibition constant | 1 | [dimensionless] |
| kL,U | lactate uncompetitive inhibition constant | 200E-3 | [dimensionless] |
| mE | Endogenous metabolism rate constant of E.coli | 0.006 | [h-1] |
| kL,R | Lactate productive inhibition constant | 12.6E-3 | [mol∙L-1] |
| v | volume of reactor | 140E-3 | [L] |
| YXE/G | apparent biomass coefficient of lactate | 8.1 | [g dry cell/ mol lactate] |
| YXE/L | apparent biomass coefficient of lactate | 5.8 | [g dry cell/ mol lactate] |
| YL/G | apparent biomass coefficient of lactate | 1.5 | [g dry cell/ mol lactate] |
4 Model for P170 promoter
Introduction
P170 is an acid-induced promoter. When rcfB protein is activated by lactic acid, it can bind to P170 and make it sensitive to RNA polymerase. In order to detect and control the concentration of lactic acid, we use P170 and RFP gene, which shows the relationship between lactic acid and fluorescence.

From the reaction network We can extract follow equation sets From the reaction network:
 |
 |
Assumptions
1. Use steady-state approximation on mRNA and mRNA-rib.
2. Assume that all enzymes activity are not affected by acid concentration, the rate constant remain unchanged.
3. Suppose that the concentration of rcfB protein is constant, its magnitude is determined by the strength of the upstream areas of promoter.
Equation Establishment
Genetic regulation circuit is shown in Figure 1.When rcfB protein is activated by lactic acid, it can bind to P170 and make it sensitive to RNA polymerase.
 |
(24) |
 |
(25) |
where KLa and K are constants and n is Hill coefficient The acP170 is the activated state, the P170 can be activated in two ways. One is to bind with the lactic acid dimerization and RcfB which can make it easy to be activated. Another one, we assume that a of P170 can be activated directly. Both the binding and unbinding P170 can be promoted while they have different rate constant.
We conclude that:
 |
(26) |
 |
(27) |
According to the equation above, we can consolidate that:
 |
(28) |
Where km1 and km2 are integration parameters.
Next, by using law of mass action and steady state solution, we deduce the equation below.
 |
(29) |
 |
(30) |
Where the concentration of mRNA and mRNA-rib satisfies:
 |
(31) |
 |
(32) |
In the end, the concentration of RFP and the fluorescence can be written as:
 |
(33) |
 |
(34) |
Thus we construct the connection between fluorescence and lactic acid, from which we can know the concentration of lactic acid through the system.
Simulation Results
We set km1 =10 and use promoter J23100, then we get the following result

Fine tuning
From the equation, we can predict that:
1. the integration parameter km1 can characterize the relative level of leakage.
2. the larger the RcfB concentration is, the quicker the fluorescence will be.
At first we have the constitutive promoter fine-tuning. The BIT-China suggests us using different promoters in our construction. The performance of promoter P170 and rCfB play an important role. We choose to use different constitutive promoter J23103 J23109 J23107 and J23100 for the result (Figure 9). According to the figures, we can get the highest rate of change in fluorescence when we use J23100 promoter which is also the most sensitive one among all the promoter testing. Therefore, we choose J23100 promoter since it is convenient to represent lactate concentration by using fluorescence as the measurement. Particularly, when we have a stronger promoter, the amount of rcfB will be more during stable state. As a result gained from equation, the P170 can be activated in a faster speed and consequently, the changing rate of fluorescence will be greater as well.

Next, we will explore the effect brought by leakage which means that P170 can activate and lead to fluorescence expression when lactate doesn’t exist. We have predicted that km1 is the index of leakage. km1 is higher, then we get more leakage shown up. Here we make k_m1 equals to 1, 10, 50 respectively and the result is shown in Figure 9. As predicted, the result is well suited to our calculation, because km1 is a constant unrelated to lactate concentration. It has a remarkable influence on the result when lactate amount is relatively small. Then we will analyze the constants related to km1, which mainly contains rate k3 that is directly activated by P170 as well as proportion , which can both affect leakage. Our target is reducing the leakage expression, thus, we need to lower those constants as much as possible.
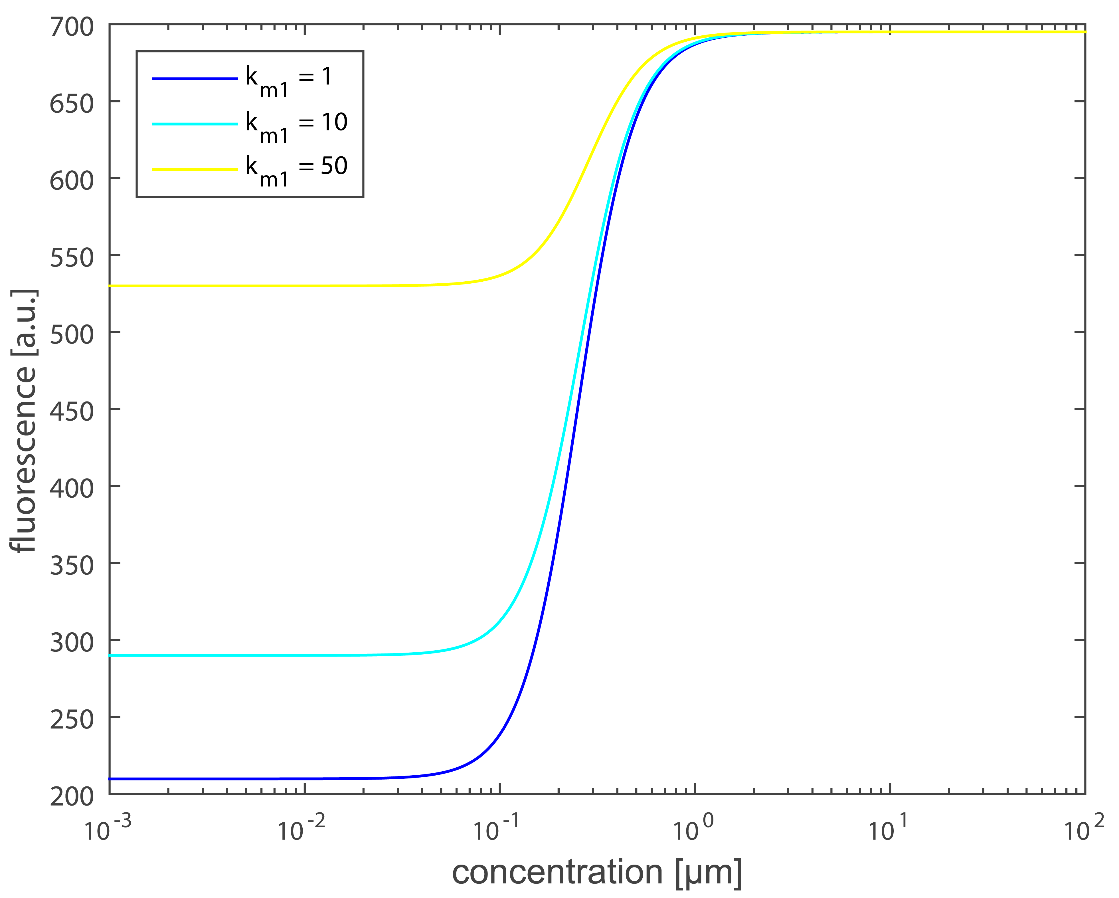
 |
 |
E-mail: ggjyliuyue@gmail.com |Address: Building No.20, No.92 Weijin road, Tianjin University, China | Zip-cod: 300072
Copyright 2015@TJU iGEM Team